


Seattle Area
Open to Remote
Designing for the future. Defining & lifting the most ideal metrics.
Full Projects

Strategy Deep Dive
Lifting All Journeys
Data Solutions
My Role: Sr Designer

Continue reading below


Improving service stickiness with better mental modeling, narrative alignment & business impact focus.
Design Approach: Lean UX
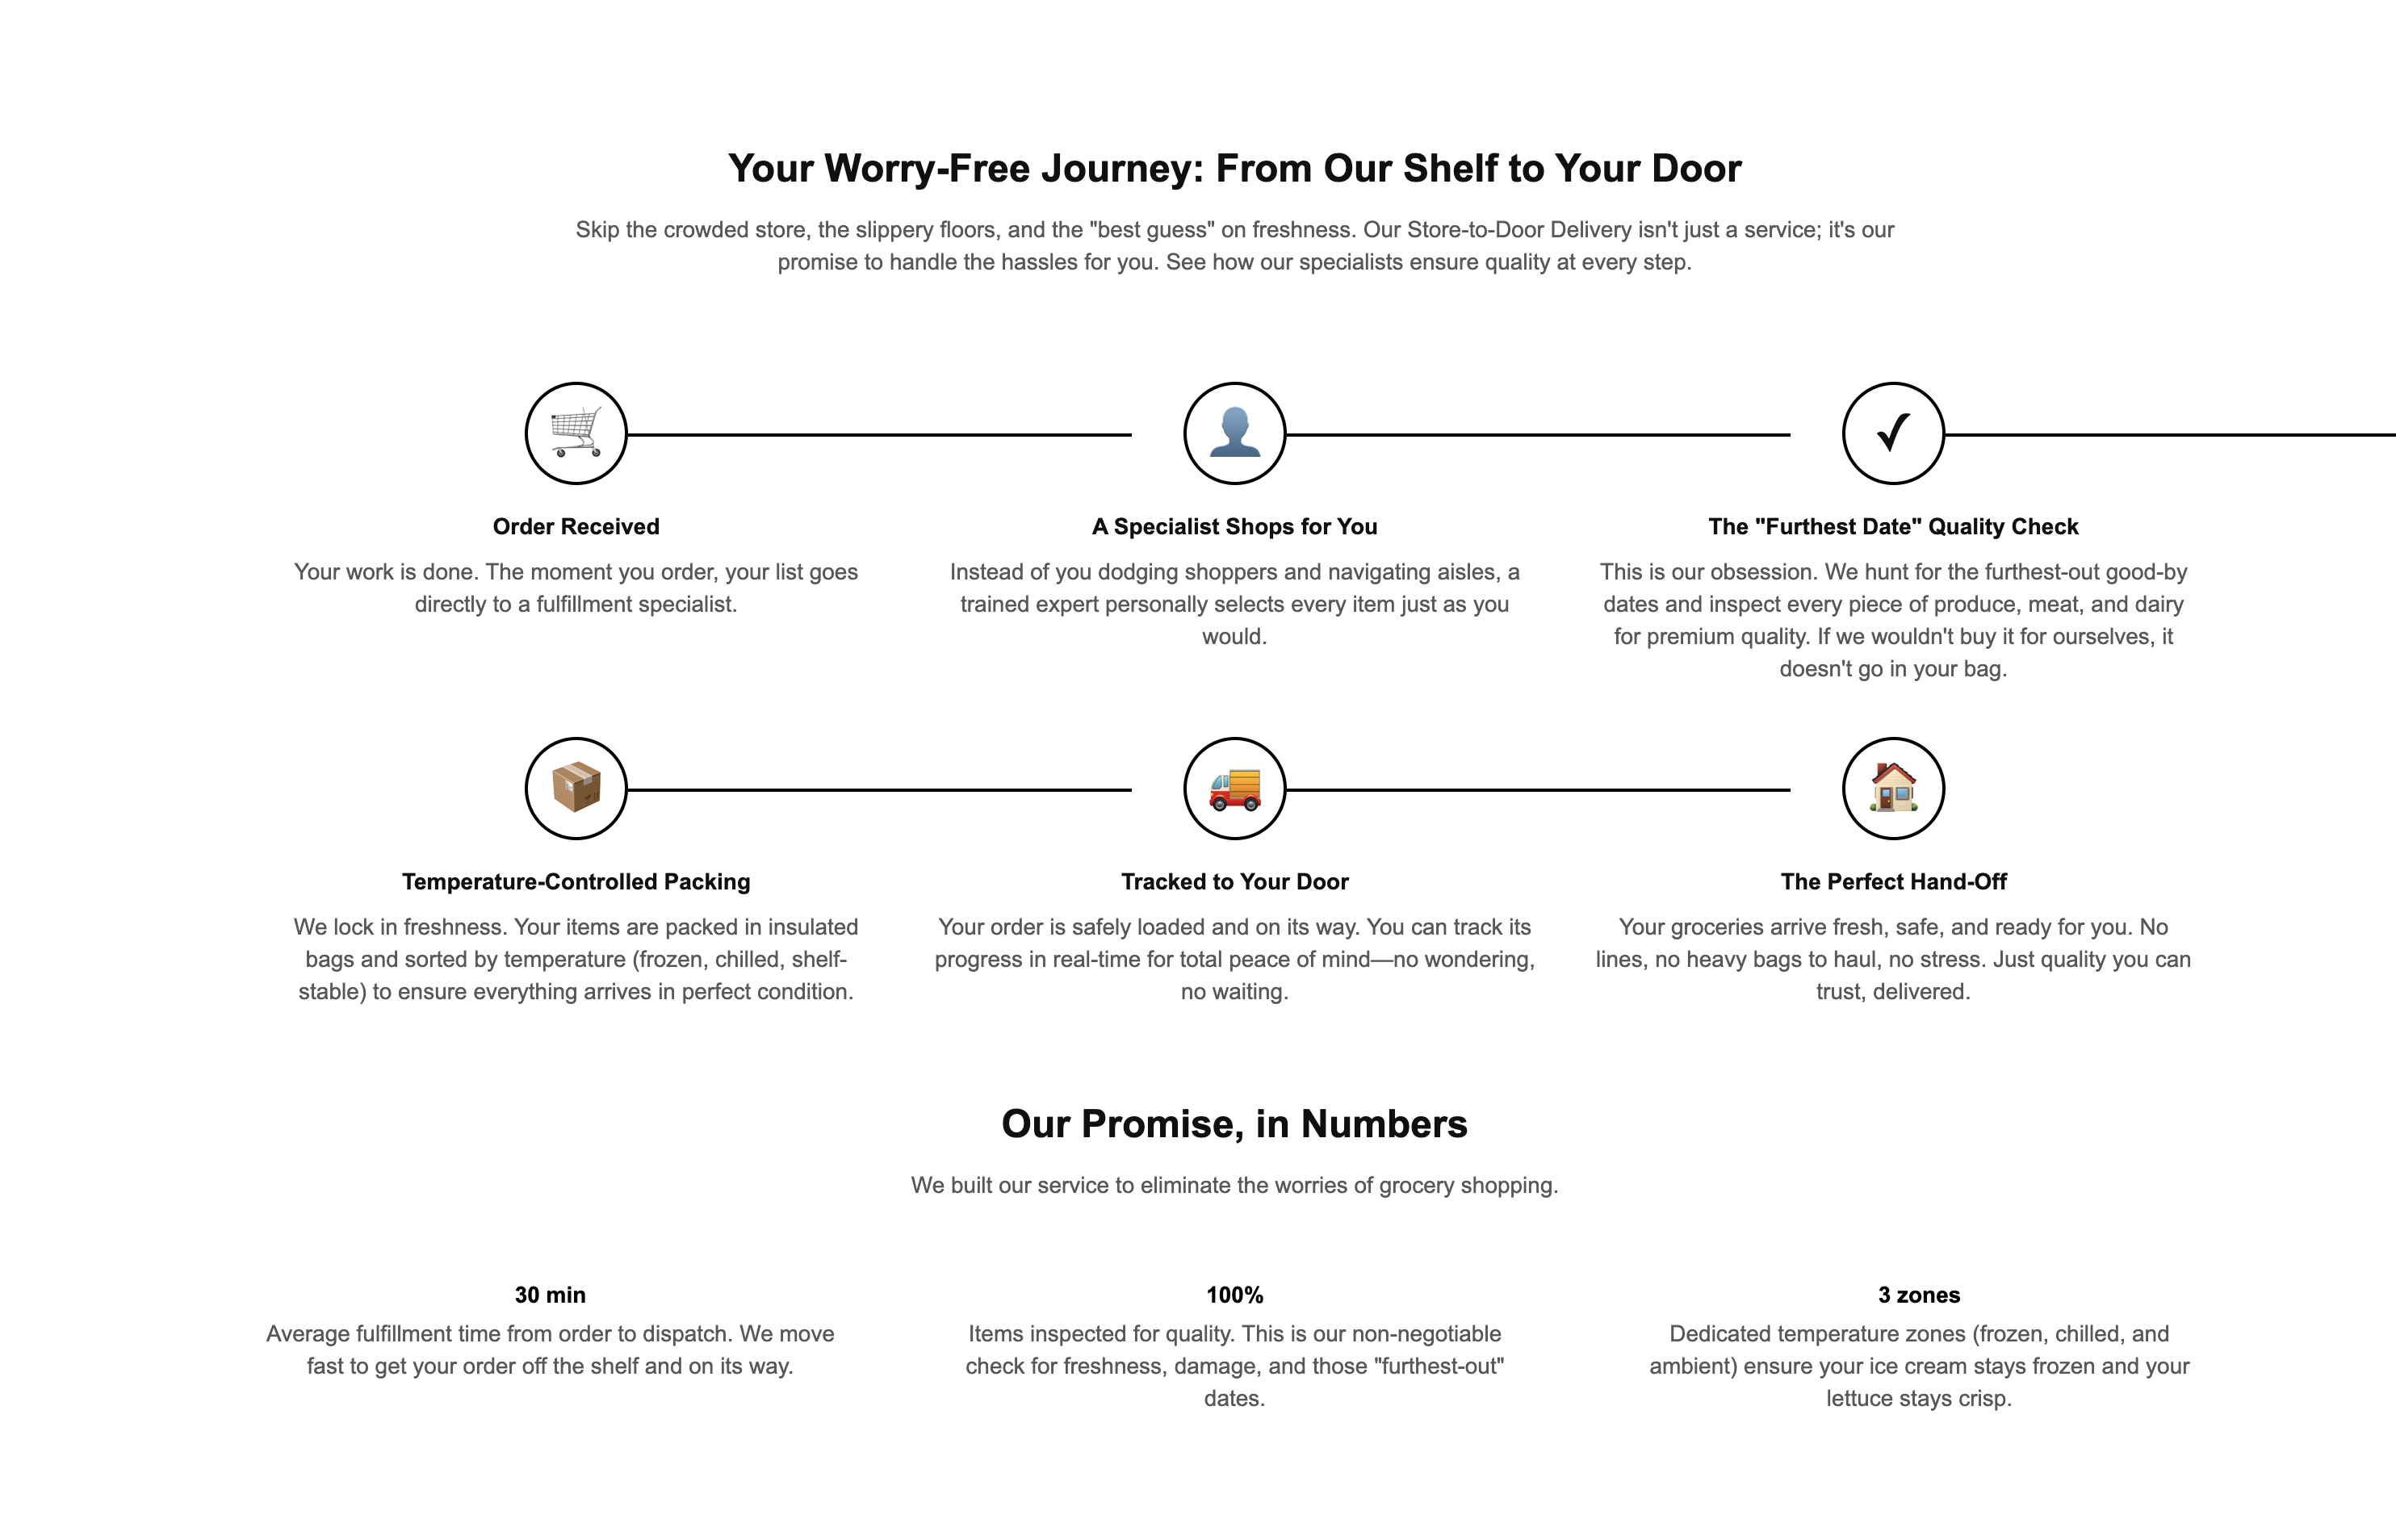
Background: Amazon’s grocery service has been positioned as a direct solution for busy professionals to attain cyclical groceries at a industry-best convenience level.
Validating Narrative: While this objective is well known and established across the mission and value areas, I sought out to measure the efficacy of the “industry-best grocery delivery experience”.
Experiment: 1 Week Length
No Changes
Growth
Time-to-value
Avg: 3:02 min
Service onboarding
23%
Engagement
Retention Rate
60%
Service Stickiness
32%
Support
Support Deflection
25%
Error Rate
6%
Signficant Confusion: Theme [Fulfillment]

Experiment: 1 Week Length
+
Data Model: Fulfillment (Static)
+
Lens: Systematic Journey
-
Business Driver: Unaligned
Growth
Time-to-value
Avg: 6:23 min
Service onboarding
53%
Engagement
Retention Rate
50%
Service Stickiness
50%
Support
Support Deflection
15%
Error Rate
30%
Experiment: 1 Week Length
/
Data Model: Fulfillment (Static)
/
Lens: Systematic Journey
/
Business Driver: Unaligned
+
Visual Language Alignment to Design System
Growth
Time-to-value
Avg: 4:49 min
Service onboarding
23%
Engagement
Retention Rate
60%
Service Stickiness
60%
Support
Support Deflection
20%
Error Rate
20%
Experiment: 1 Week Length
/
Data Model: Fulfillment (Static)
+
Lens: Goal/Value
/
Business Driver: Unaligned
/
Visual Language Alignment to Design System
+
Content Strategy Aligned to Goal/Value
Growth
Time-to-value
Avg: 4:21 min
Service onboarding
83%
Engagement
Retention Rate
80%
Service Stickiness
70%
Support
Support Deflection
50%
Error Rate
3%
Experiment: 1 Week Length
+
Data Model: Fulfillment (Static)
/
Lens: Goal/Value
+
Business Driver: Grocery Flow
/
Visual Language Alignment to Design System
/
Content Strategy Aligned to Goal/Value
Growth
Time-to-value
Avg: 3:40 min
Service onboarding
88%
Engagement
Retention Rate
90%
Service Stickiness
80%
Support
Support Deflection
85%
Error Rate
2%
→
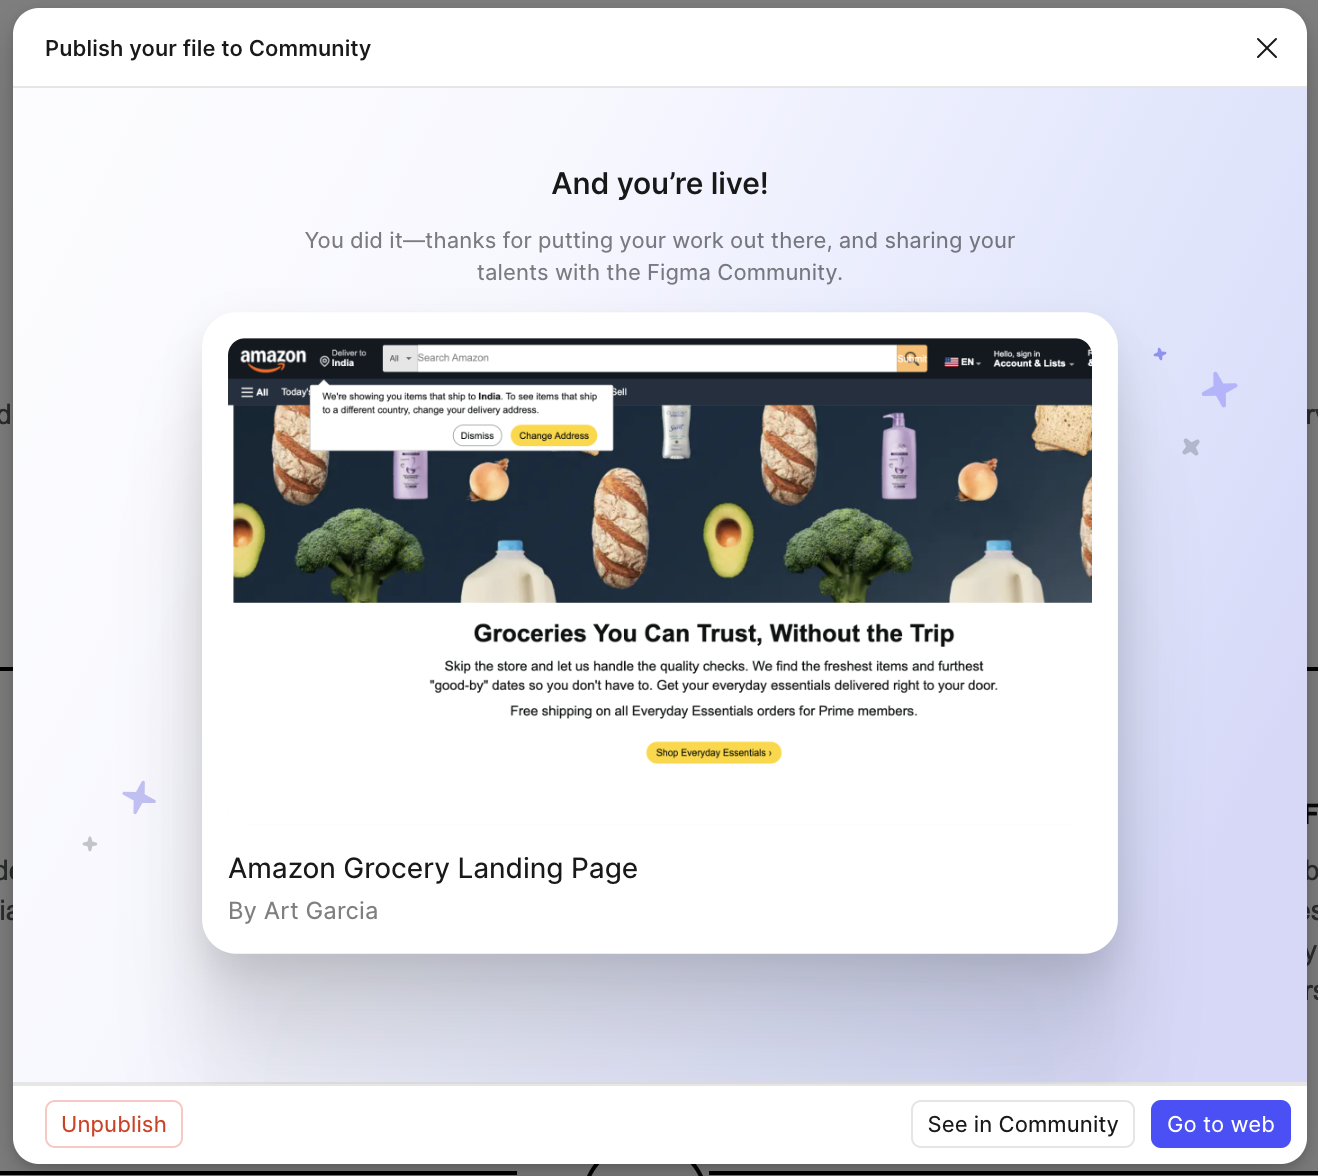
Access Live Prototype on Figma Make
Projects, case studies & more
Strategy
Data Model
Narrative
Business Objective
Execution
Quality of Process
Quality of Information
Quality of Research
Validation
Growth Lift
Engagement Lift
Monetization Lift
Support XP Lift
Security & Governance Lift
Recent exploration

Designing for Trust in Autonomous Mobility
1. Booking & Confirmation: We visualize the autonomous system actively finding and confirming a vehicle. This animation communicates Trust, assuring the user that the system is responsive and reliable.
2. En Route & Proximity: The real-time, path-following animation shows the vehicle's progress. This builds Confidence, transforming a black-box process into a transparent, predictable journey.
3. In-Vehicle Interaction: By animating the vehicle's perception of the world, we provide a narrative for its actions. This animation fosters Clarity, ensuring the user feels in control and understands the "why" behind every maneuver.
Data Modeling Animation
In order to properly communicate to Uber functional partners the various areas that need to be evaluated. I created this animation, which highlights the interplay between the system phenomena. The objective here is to ensure no system process is hidden and additionally that the mental models that require intentional interpretation of system change are readily in place and prepared for instead of waiting for usability errors to surface these gaps
3
2
1
Date Explored: 10/2025
Stage 1 Execution
Stage 2 Validation
1-hour or under projects
Enabling increased customer activation with a dynamic native app for the sales floor and experience team.
Journeys: Sales Onboarding Experience, Customer Onboarding Experience.
My Role: Ownership, Mentorship, Buy-in Lead, Designer
Arturo Garcia, Back At You Media, Onboarding
Executive Summary:

Company
Back At You Media existed as the premier purveyor of marketing automation in the era before plentiful, highly accessible A.I. agents. The core flagship products served the marketing efforts on the most popular social media sites like Facebook, Twitter, Instagram.Facebook (& others) had been driving customer leads for real estate professionals for more than a decade.

Core Value Proposition
Brand creation relied on having a successful social media presence. Families, friends and notable neighborhood figures require trust for most financial decisions. Financial decisions in the hundreds of thousands of dollars made trust a non-negotiable. The Back At You sales team executed a diligent effort to stay on top of configuration requirements for the various technologies in play for a large scale automation effort.
Situation
During inquiries for the automation service and during customer onboarding efforts, support and sales team often had to pivot mid effort as social media providers routinely changed terms and conditions affecting the overall configuration flow for our service.This looming state of instability required teams across the organization to come up with their own processes to address edge cases and possible untapped scenarios. Governance updates across each time on process change ultimately added additional work for each team lead, further exasperating operations bandwidth.This ever-changing dynamic learning curve to activate users resulted in a large drop-off rates for new users and ongoing headaches with existing users further affecting service retention rates.
Task
To address this dynamic problem space, I took it upon myself to analyze the existing ad-hoc solution our teams put together in order to lessen customer friction. I modeled the information intake, analysis, evaluation flow for both the Support Team and the Sales Team when serving customers.
Support Team [Existing Old]
Customer
Information

System Response

System Change

Team Guidance
Team Troubleshoot
Support Team [Proposed New]
New
Digital
Solution
System Change
Customer
Information
System Response
Team Guidance
Actions
Applied a systems mindset to overcome the various data flows making up the complex user journey for onboarding new users at both exposure points — support (experience team) and sales. Additionally had to map and model changes on how our solution would handle dynamic 3rd party services (Meta Graph API, Twitter API, Instagram Graph API, LinkedIn Marketing API) I then conducted a user centered design problem state analysis to determine the type of process best suited for the problem.
Optimize
Extend
Remediate
Generate
Winner!
Problem State Classification
I arrived at the Optimize Problem Space Classification which looks to improve an existing functional pathway. The key is pathway as there are several processes that do need to be reframed and updated through a new digital experience.
We agreed upon on a LeanUX approach to take advantage of the quick turnaround. The objective - come up with a solution that can be tested immediately to quickly surface insights on the revamped digital pathway.
Lean UX
User Centered Design (UCD - ISO Standard)
Winner!
Narrowing-Down Framework
Result

Sales Team
Increased Sales
Process Seamlessness

Experience Team
Decreased Experience
Friction
The native application completely transformed how new and existing users re-activated back into the service as dynamic changes continued to occur with integration partners.
The digitalization of analog governance processes enabled a far better frictionless growth experience for customers, internal employees and subsequent support administrators. The goal value lens of internal teams now aligned with one another as a single source of truth determines governance and content strategy pivots.
Automating the issue classification for all incoming inquiries greatly deflected the total number of experience issues that required escalation. Total number of errors also decreased as service experience was not tied to analog processes executed ad-hoc by team leaders but instead meticulously co-analyzed and co-evaluated by all leadership.
A/B Test Summary:
MVP
Key Lift
Segments
User Retention
Uplift +25.1%
Enterprise
User Retention
Uplift +25.1%
Professional Users
Feature
Feature Stickiness
70%
Native App Governance
Sales Team
Feature Stickiness
54%
Native App Governance
Success Team
V3
Key Lift
Segments
User Retention
Uplift +55.1%
Enterprise
User Retention
Uplift +75.1%
Professional Users
Feature
Feature Stickiness
89%
Native App Governance
Sales Team
Feature Stickiness
94%
Native App Governance
Success Team
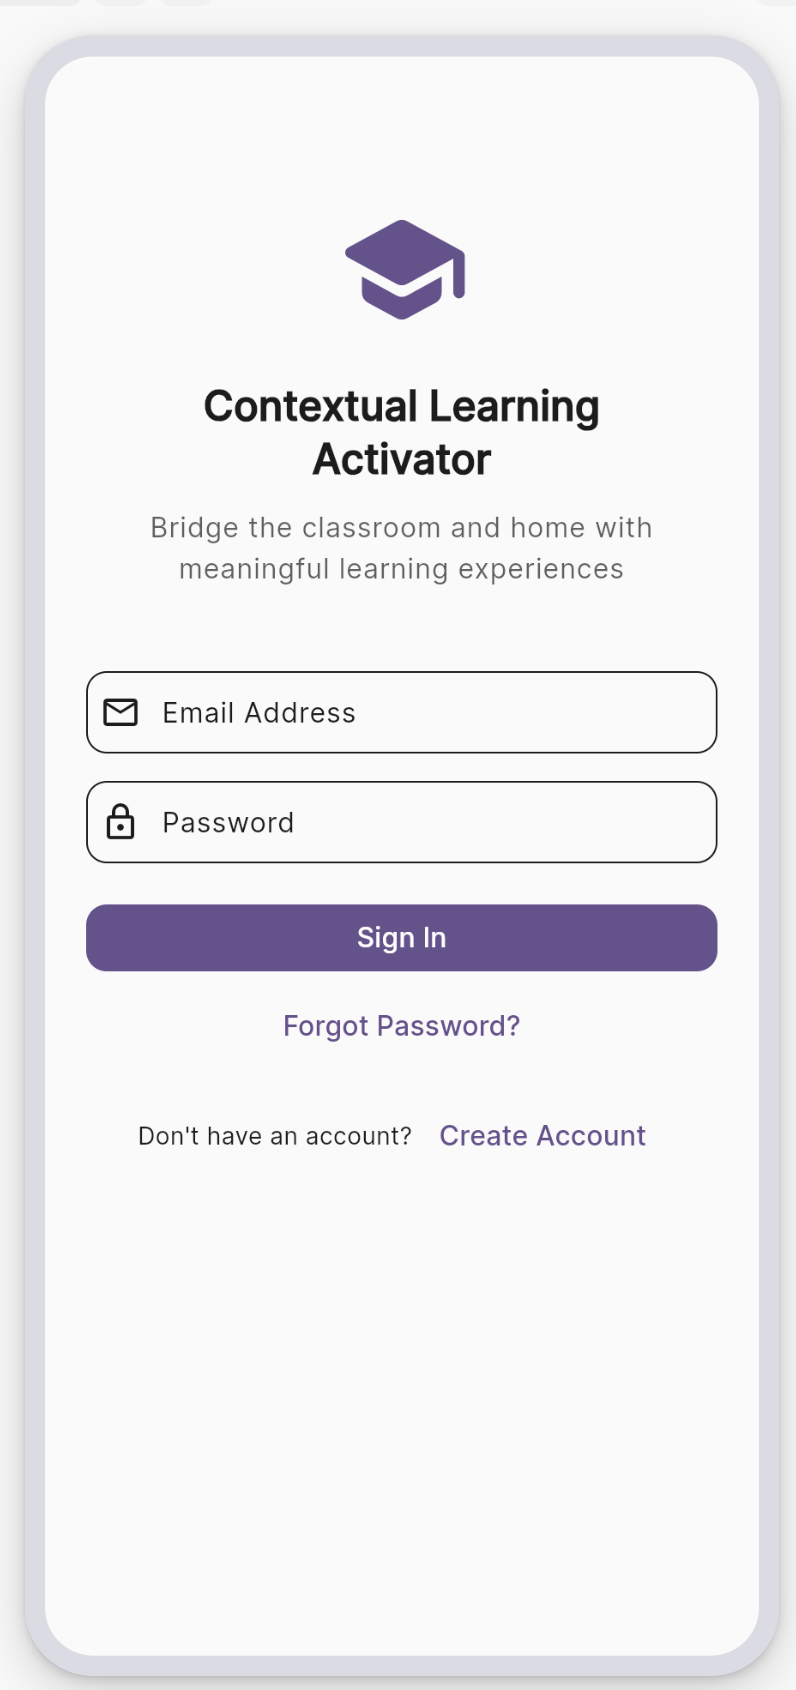
Enhancing time-to-value for teachers & parents with dynamic classification-centric digital experiences & service experience.
Goals: Aligned learning opportunities outside of school so students can learn, adapt and take ownership of learning outside of the school environment.
User Journeys: Authentication, Authorization, Account Creation, Education Alignment, Education Bridging
Mental Models: Teacher Curriculum, Parent Teaching, Student Learning Style
My Role: Strategy, Execution, & Validation
Arturo Garcia, Bridge-bound (Stealth Startup),
Executive Summary:

Company
Bridge-bound is the culminations of decade long teaching experiences in academia.
The core experience Bridge-bound seeks to surface and align internal cognition of parents who are increasingly busy, active and require additional support in growing their child’s comprehension level in the real world, contextualizing for growth.
Core Value Proposition
Frictionless authorization required buy-in from across the academic group. Teacher segments to school district admins needed careful and secure measures to keep the children in the school district safe. Layers of authorization and authentication are built with seamlessness in mind, using single-click processing when possible and highly automated inputs whenever possible. For teachers, one of the most unique aspect about the unique interactions now possible with Bridge-bound was the automated creation of design artifacts that can be freely shared with parents and suggest ideal placement, lifestyle adaptation of the curriculum and other tips centered around busy schedules.
Situation
Existing dissemination and contextualization of learning experiences for publicly enrolled remains a largely separate experience across the United States. Engaging students on daily curriculum is routinely dynamic depending on the parenting styles of various cultures, parents and situations further defining the difficult nature of curriculum exploration at home. Concept stickiness is also additionally harder to achieve with the advent of highly interactive experiences that can be found and accessed outside the more strict structure of a school environment.
Task
Addressing the multi-segment flow for contextualizing experience started with modeling the points of information processing routinely taken when teaching any subject matter and extended out to the point where several handoff points are actively monitoring curriculum delivery states such as delivery during an “in-active parent routine”. First-round builds emphasized highly accessible, usable information submission points (Input Fields, Information Pickers) in order to maximize the total number of support deflections. Additionally the feature stickiness was critical to ensure retention was as high as possible leading to some interesting treatment options for the curriculum summaries and broad task objectives.
Actions
Applied a systems mindset to overcome the various data flows making up the complex user journey for onboarding new users at both exposure points — support (experience team) and sales. Additionally had to map and model changes on how our solution would handle dynamic 3rd party services (Meta Graph API, Twitter API, Instagram Graph API, LinkedIn Marketing API) I then conducted a user centered design problem state analysis to determine the type of process best suited for the problem.
Optimize
Extend
Remediate
Generate
Winner!
Problem State Classification
I arrived at the Optimize Problem Space Classification which looks to improve an existing functional pathway. The key is pathway as there are several processes that do need to be reframed and updated through a new digital experience.
The client and I agreed upon this framework as it take sadvantage upon on a LeanUX approach to take advantage of the quick turnaround. The objective - come up with a solution that can be tested immediately to quickly surface insights on the revamped digital pathway.
Lean UX
User Centered Design (UCD - ISO Standard)
Winner!
Narrowing-Down Framework
Result
V3
Journey: Authentication Flow
Technology: Firebase Auth
Narrative: Sparking the journey

Teacher Segment
Seamless Uploading
Parent Segment
Frictionless Short Activities
The latest iOS application enabled increased alignment for contextualized experiences. The enhanced activation of parents and specifically curriculum at home activities created a sharp increase in overall journey stickiness. With thoughtful definition of the problem space and a digital solution, addressing the many authorization and authentication obstacles, the experience provided a far more seamless and frictionless approach to quick learnings and very short activities that can be done at any time of day. A/B testing for the MVP enabled quick changes to the initial stages of parent district authorization by introducing a single button, information processing. Which was now being communicated as an asynchronous approach, rather than an individual, subsequent set of steps that required a wait time or a processing time.
Next Step: Thurston County School District Trials in Washington, following agreement.
A/B Test Summary:
MVP
Key Lift
Segments
User Retention
75.1%
Teachers
User Retention
35.1%
Parents
Feature
Feature Stickiness
80%
Curriculum Sharing
Teachers
Feature Stickiness
34%
Activity Journey
Parents
V3
Key Lift
Segments
User Retention
Uplift +21%
Teachers
User Retention
Uplift +55.1%
Parents
Feature
Feature Stickiness
98%
Curriculum Sharing
Teachers
Feature Stickiness
79%
Activity Journey
Parents
1-hour or under projects
1-hour or under projects
Corelogic
Project Objective:
Discovered & implemented positive uplift for key business drivers: Growth, Engagement, & Security/Governance
Growth
Engagement
Security/Governance

9:41


24


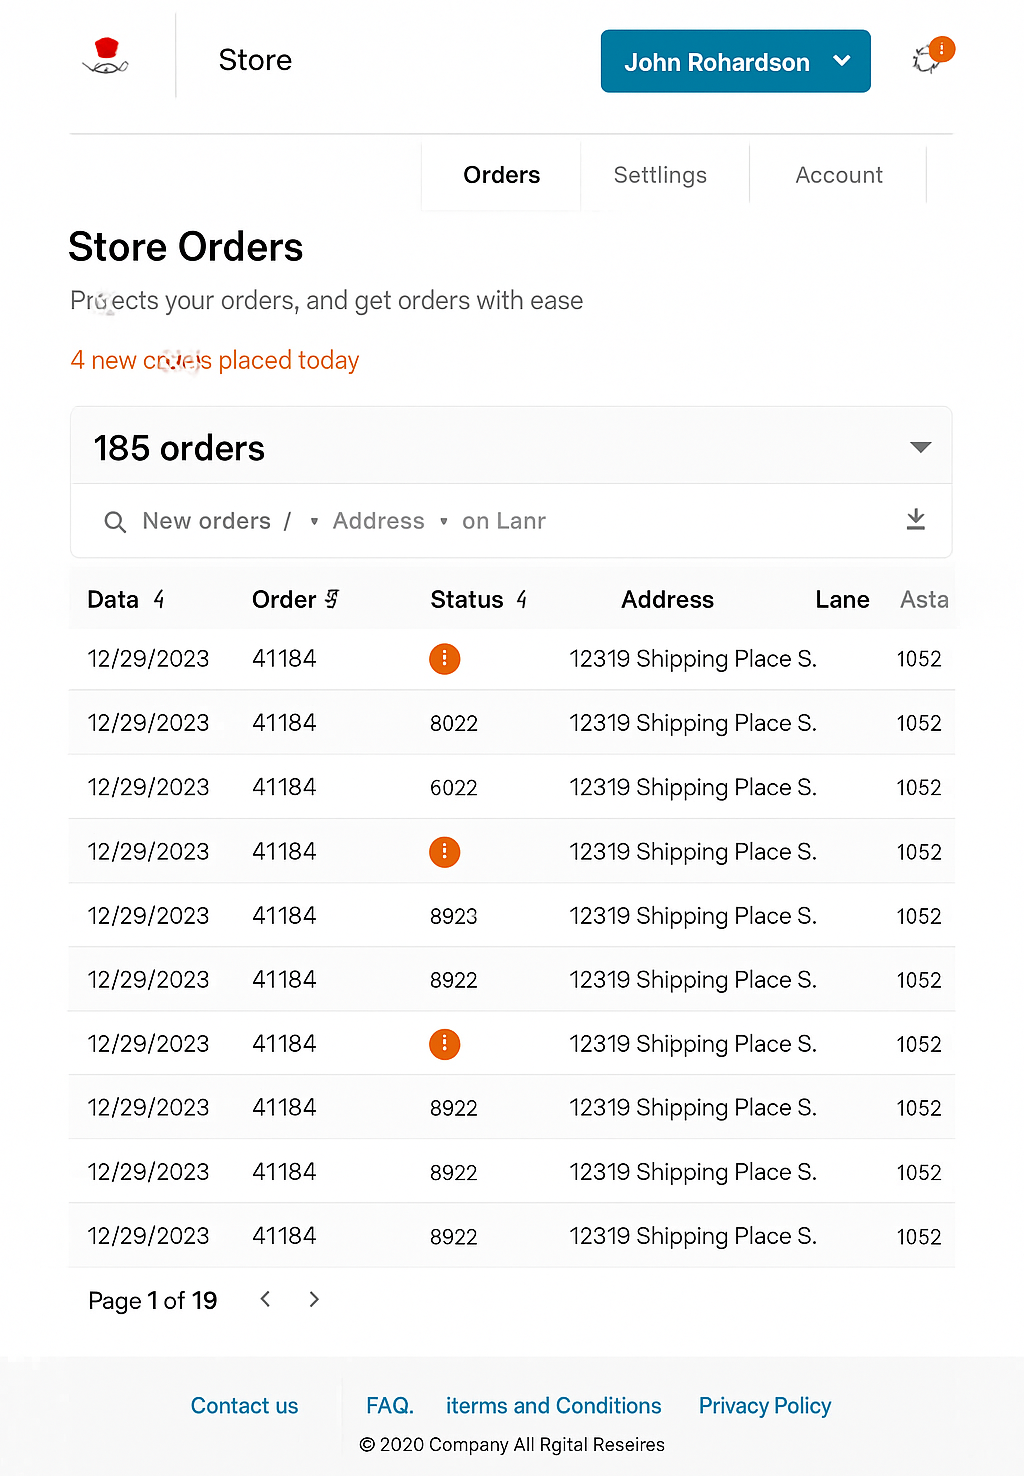
www.


Store


3
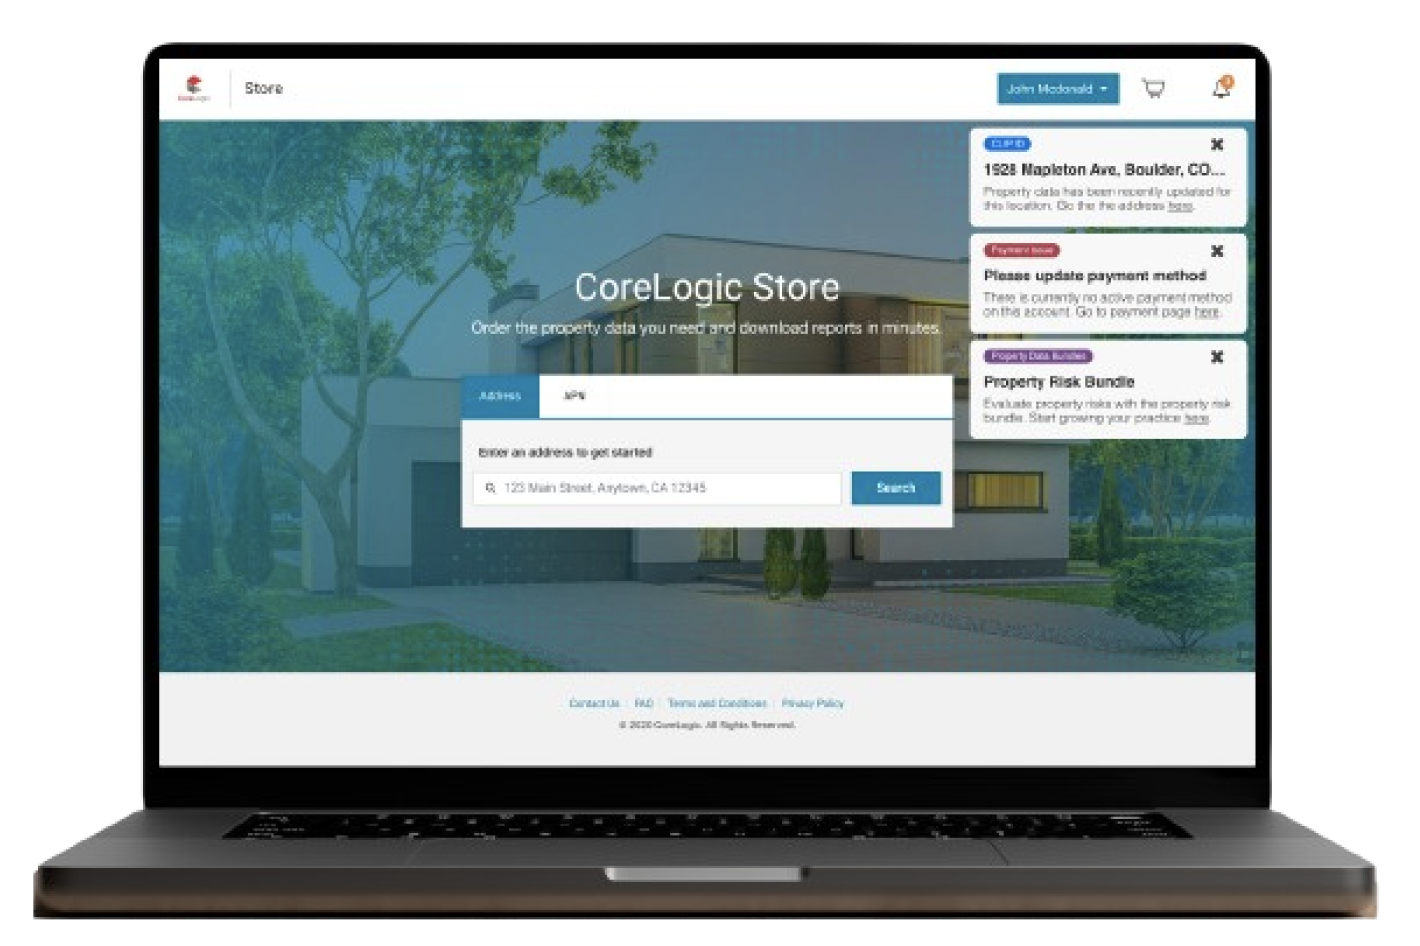
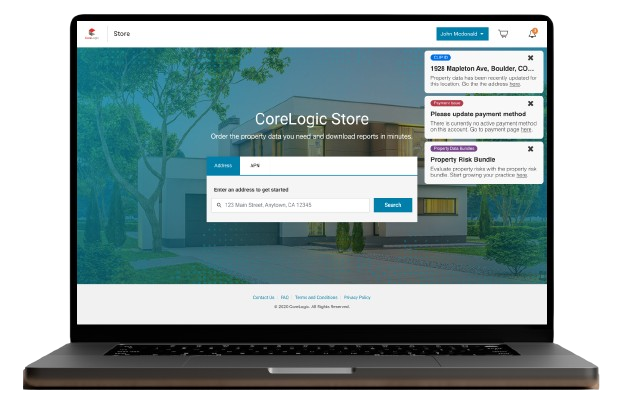
Instant Property Data
Order the property data you need and download reports in minutes.
123 Main Street, Anytown, CA 12345


CLIP ID

1928 Mapleton Ave, Boulder, CO 80304
Property data has been recently updated for this location. Go the the address here.
Payment Issue
Please update payment method
There is currently no active payment method on this account. Go to payment page here.
Property Data Bundles
New
Property Risk Bundle


Evaluate property risks with the property risk bundle. Start growing your practice here.

Home

Portfolio
Search

Offers

Dashboard
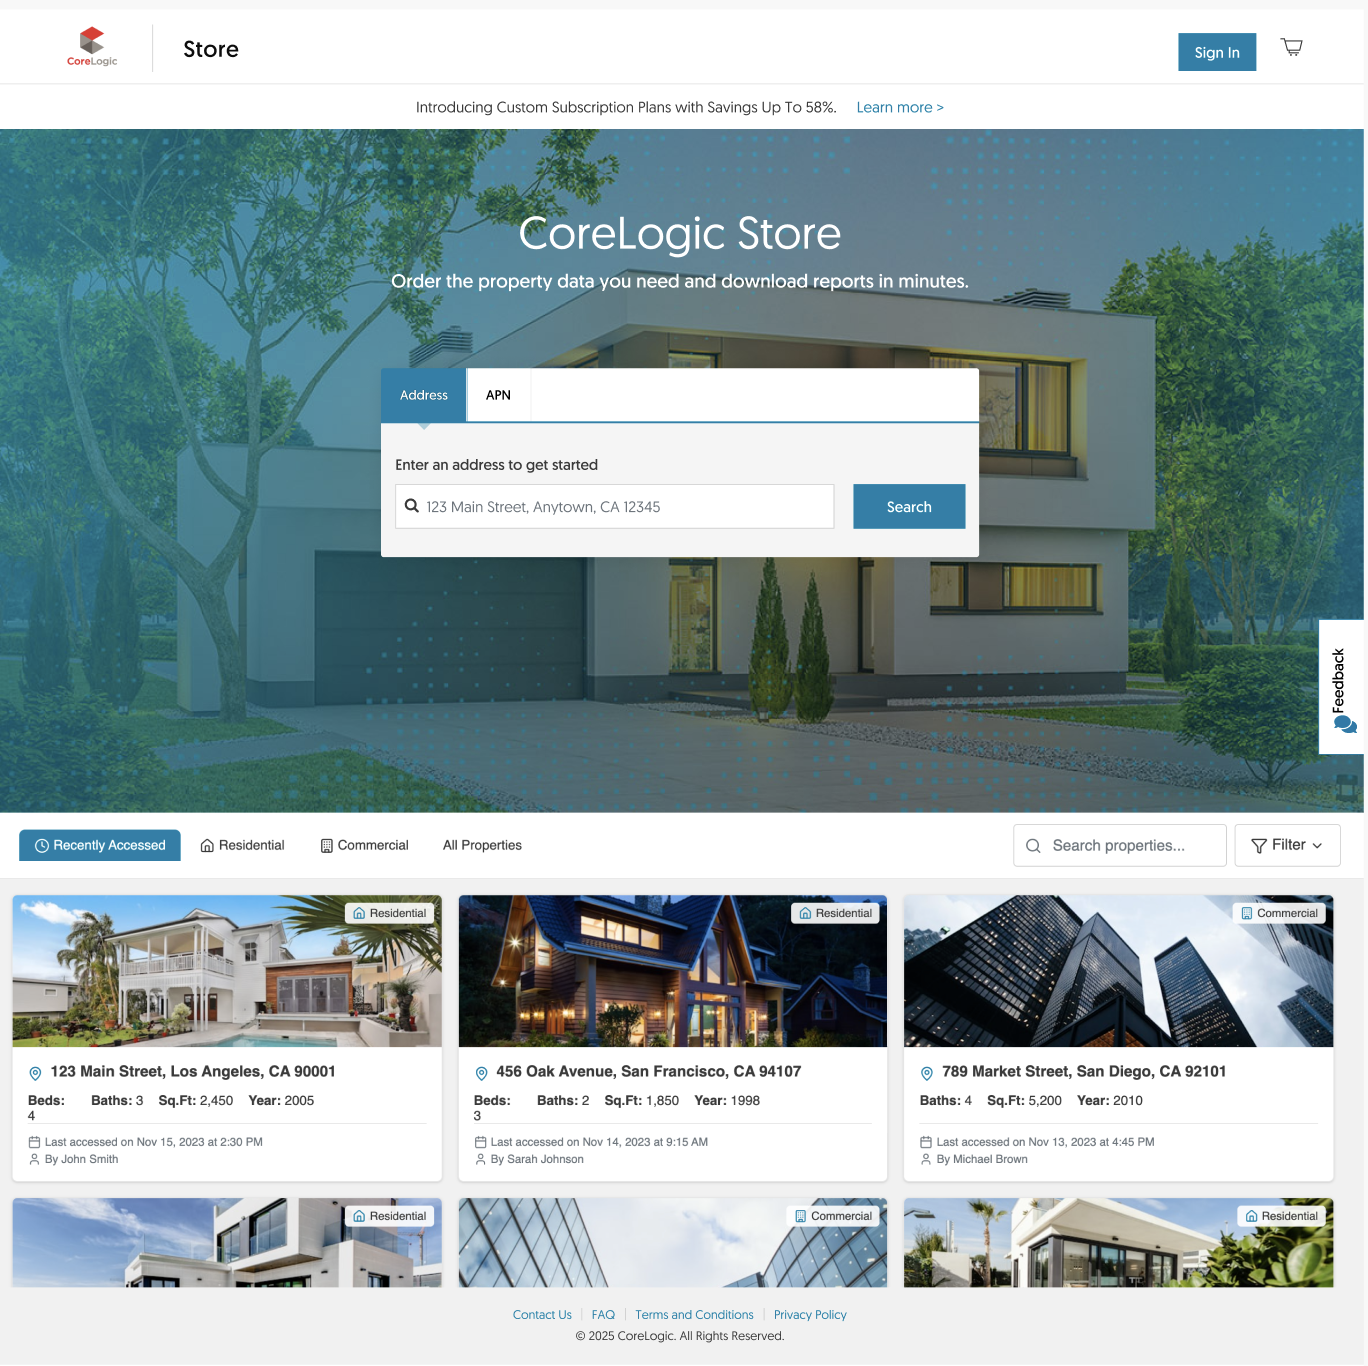
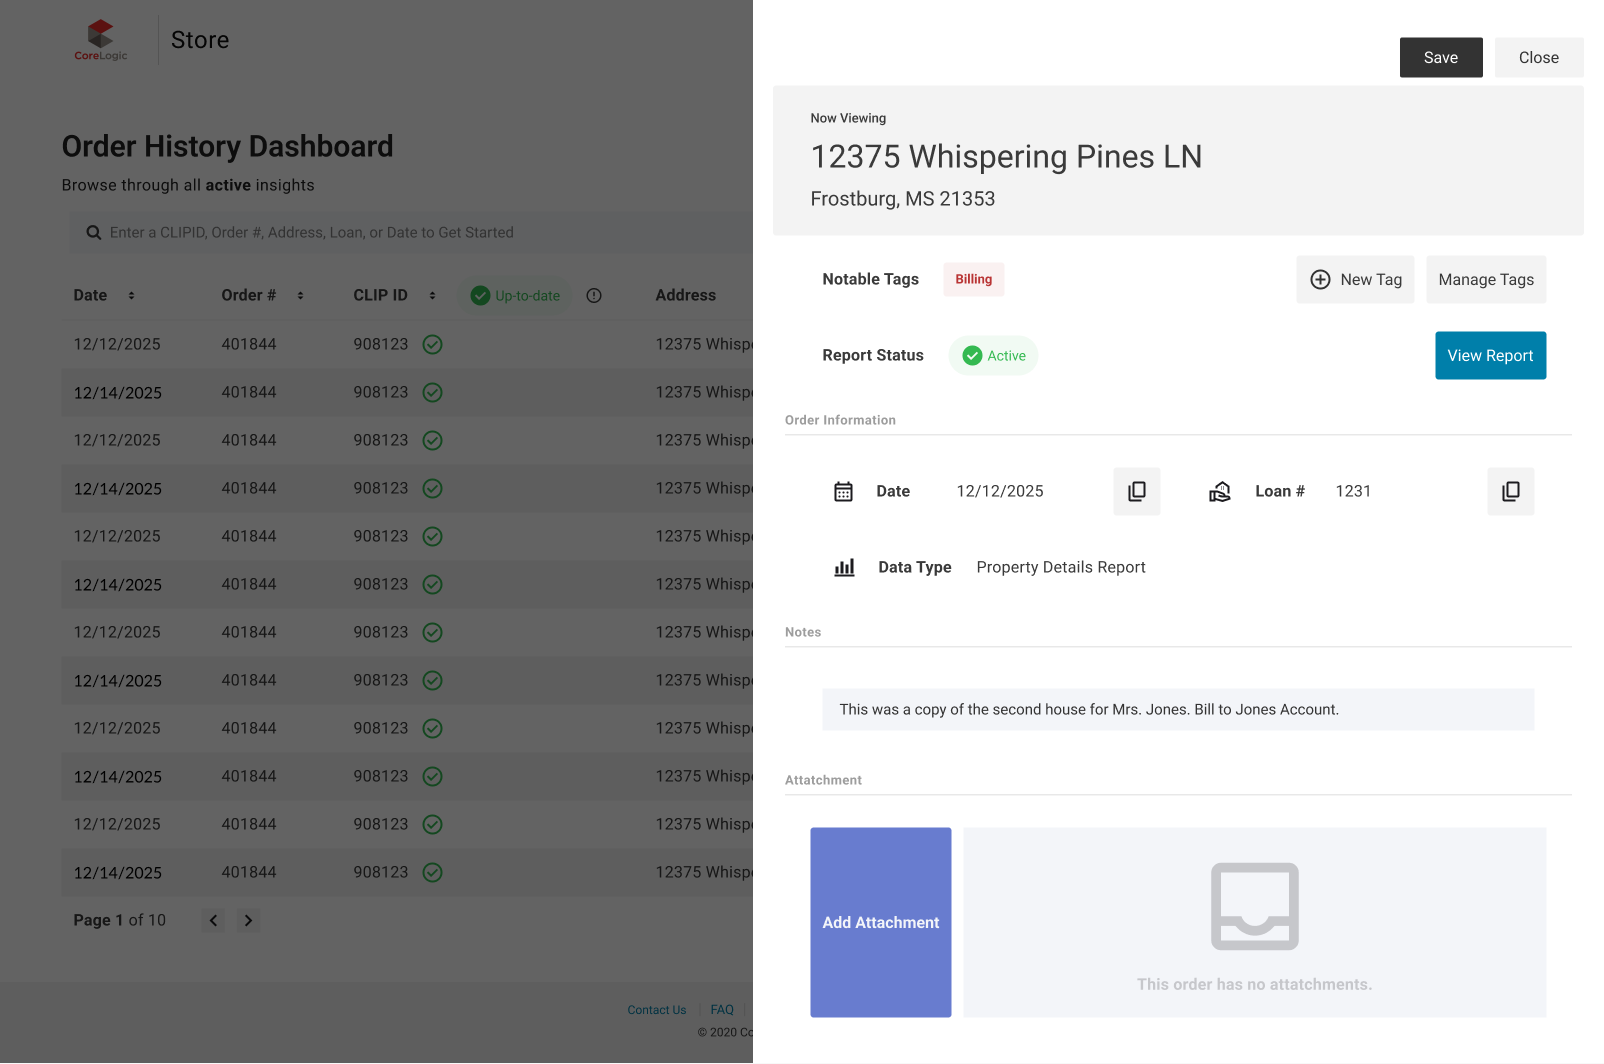
Payment Flow, Discovery Experience & Growth Initiative
Arturo Garcia, Corelogic (Now Cotality), Property Data
Making it easier to experience high quality data on the instant data platform.
Payment Flow, Discovery Experience & Growth Initiative
Journeys: Payment Experience, Discovery Experience, Personalization Experience, Admin Experience, Upgrade Experiencce
My Go-To Resource Stack
I believe in leveraging technology to amplify creativity, not replace it. My workflow is built around a modern stack where AI acts as a co-pilot, helping me move faster and focus on what truly matters: strategic thinking and solving complex user problems. These are the tools and resources I use to automate tedious tasks, build robust design systems at scale, and ultimately, design smarter. Think of it as your toolkit for the future of design.

IxDF
World’s Largest Free Online Resource on UX Design
Figmaster
World’s Largest Free Online Resource on UX Design

Pathrise
1-on-1 mentorship, training and advice.

Riddle UI
UI design system offering range of features and components.

SOME TOOLS & RESOURES
A.I. Course
From
Raw Data
to
Decisive Action
This course is built on a simple, powerful premise: your ability to contextualize a problem for A.I. directly determines the quality for the solution. We give you the playbook to do it every time.
Problem Space
The age of AI isn't coming, it's here. But for most leaders, the reality feels less like a competitive advantage and more like overwhelming noise.
Is Your Organization Navigating AI with a Map, or Just a Compass?
- Are you tired of generic, uninspired outputs from tools like ChatGPT that lack true business context?
- Do you feel a growing pressure to articulate a clear AI strategy for your team or board, but aren't sure where to begin?
- Are you concerned that competitors are moving faster, leveraging AI in ways you haven't yet unlocked?
- Do you struggle to translate the potential of AI into tangible, high-value business outcomes that drive revenue and growth?
If you're asking these questions, you're not behind—you're at the starting line of true leadership.
Join a select group of pioneers who will be the first to get access, a special launch discount, and exclusive pre-course content.
👉 Join the Exclusive Waitlist
COURSE
From
Raw Data
to
Decisive Action
Solution Space
A.I. Course
AI for Business Leaders" isn't about the history of neural networks or how to code in Python. It's a rigorous, operational framework designed to transform you from a passive consumer of AI into a strategic conductor of it.
We teach you the art and science of Contextualization: the ability to frame any problem, industry, or solution space in a way that allows AI to function as a true strategic partner. You'll learn to go beyond simple prompts and engineer high-quality outcomes that are insightful, defensible, and ready for the boardroom.
This is Not Another "Intro to AI" Course. This is a Strategic Playbook.
This course bridges the critical gap between raw AI output and executive-level impact.
From
Raw Data
to
Decisive Action
A.I. Course
Course Modules
🧠 Module 1: The Leader's AI Foundation
What You Will Master
Forget the computer science lecture. We build your strategic mental models for thinking about AI. Learn the frameworks for evaluating AI tools, understanding their limitations, and identifying the highest-leverage opportunities in your business.
🎯 Module 2: The Art of Contextual Framing
This is our core methodology. Learn how to deconstruct any problem or industry—be it logistics, fintech, or healthcare—into a structure that AI can understand. Master techniques for "teaching" the AI the nuances of your specific business reality.
💡 Module 3: Engineering High-Value Outcomes
Stop getting generic lists. Learn advanced prompting and interaction patterns to elicit deep analysis, uncover hidden opportunities, generate innovative solutions, and perform competitive intelligence at a scale and speed you never thought possible.
🎨 Module 4: Designing for Influence
An insight is useless until it's communicated. This module teaches you how to take your AI-generated outcomes and package them for maximum impact. Learn to craft compelling narratives, design persuasive presentations, and build data-backed arguments that win budgets and align stakeholders.
⚙️ Module 5: Operationalizing Your AI Edge
Put it all into practice. Develop workflows for your team to embed these techniques into your daily operations—from market research and product development to M&A analysis and strategic planning.
From
Raw Data
to
Decisive Action
A.I. Course
Good For
- Executives & VPs (SVP, VP, C-Suite): Tasked with setting company-wide strategy and finding a durable competitive edge.
- Directors & Department Heads: Responsible for translating high-level strategy into operational excellence and team performance.
- Founders & Entrepreneurs: Who need to be scrappy, act fast, and leverage every possible advantage to disrupt markets.
- Product Leaders & Managers: Who must deeply understand customer problems and market dynamics to build winning products.
- Strategy & Management Consultants: Whose value is predicated on delivering superior insight and actionable plans to clients.
This Course is Designed For:
It's for strategic thinkers who believe technology should serve strategy, not the other way around.
From
Raw Data
to
Decisive Action
A.I. Course
Submit to Waitlist
Waitlist members receive:
- ✅ A guaranteed 25% early-bird discount.
- ✅ Exclusive pre-launch content and strategy guides.
- ✅ A chance to help shape the final curriculum with your feedback.
Become the Leader Who Connects the Dots.
The future belongs to those who can synthesize information, design strategy, and influence others. AI is the most powerful tool ever created to do all three.
Join the waitlist to be the first to know when "AI for Business Leaders" launches.
Join Waitlist
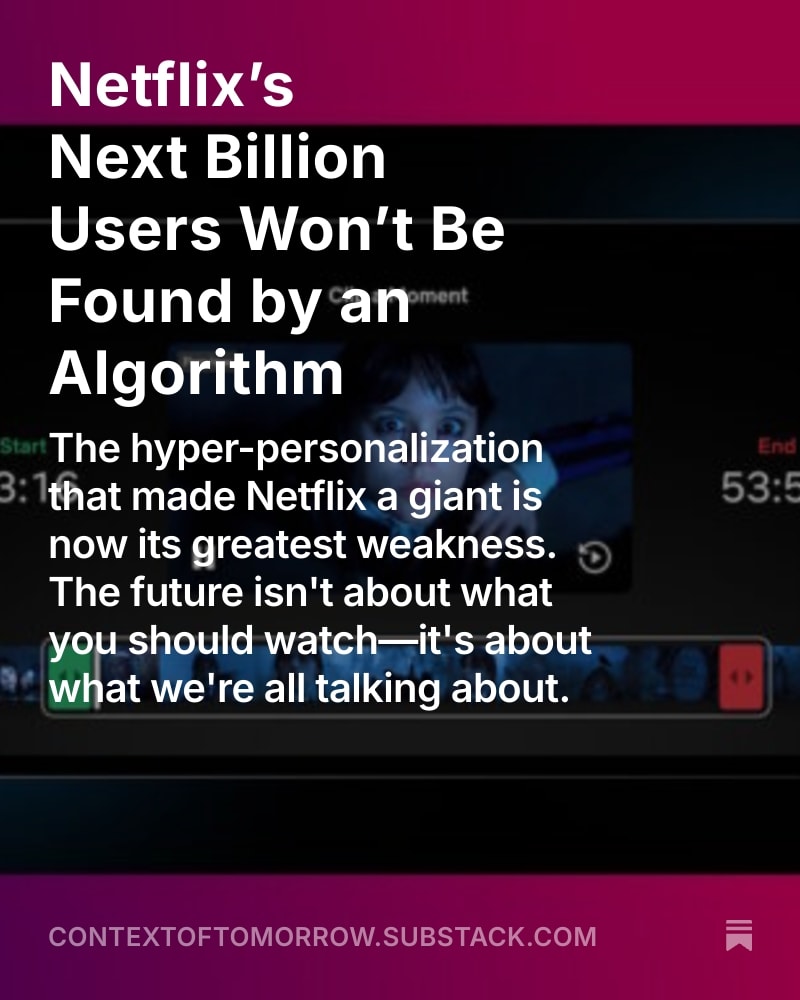
Netflix
Live Event Operations & Production XD
CASE STUDY
Approach: Lean UX
Hypothesis-Forward

A.I. usage
in use

Guiding Principles
Mission: “to entertain the world”
Recent Past Pivot & Focus: Report
A.I. usage
in use
Lean UX
Understand & Think
Business Outcome & Context
Organizational Principles
As of June 2025
Shift away growth, towards unique monetization
- Revenue maximization
- Content as core value adv.
- Diversified revenue
- Operational resilience
Design Driving Force:
Hypothesis Testing
Solution Space
Problem Space
Live Event Infrastructure
Content Ingestion & Processing
Live Steam Management & Monitoring
Global Distribution & Delivery
Workflow Automation & Prediction
Digital Phenomena
Inferred Experiences: Content Ingestion & Processing
AWS Elemental
MediaConnect
MediaLive
Wrapped Custom-build internal tools
Inferred Experiences: Live Stream Management & Monitoring
Live Event Manager (LEM)
Atlas
Mantis
Lumen
Inferred Experiences: Global Distribution & Delivery
Open Connect Portal
Wrapped cutomer-build partner internal tools
Inferred Experiences: Event Planning & Workflow Automation
Unnamed application: Event scheduling & resource allocation
Wrapped Custom-build internal tools
Testable Hypothesis

Narrowing Focus
Testable Areas
Solution Space
Problem Space
Design Treatment Area
Journey
Page
Single Component
UI
NON-UI
Measurement Areas
Solution Space
Problem Space
A.I. usage
in use
Metrics to measure:
Event Planning, Prediction & Workflow Automation
- M - Magnitude: The "How Much?" Question
- Resulting KPI: Total Events in Automated Workflow
- Inferred Trend: Increase 📈
- Evidence: Netflix is expanding its live event slate, and the stated goal of leveraging its technology for operational efficiency means more of these events will be handled by automated systems.
- E - Efficiency: The "How Fast/Easy?" Question
- Resulting KPI: Event Workflow Creation Time
- Inferred Trend: Decrease 📉
- Evidence: To be more agile and responsive in the competitive live events space, Netflix needs to reduce the time it takes to set up a new event, making a faster workflow a high priority.
- T - Threshold: The "Did It Work?" Question
- Resulting KPI: Successful Automated Workflow Completion Rate
- Inferred Trend: Increase 📈
- Evidence: A high completion rate is essential for reducing the risk of a high-profile live event failing, making reliability a core pillar of this new business vertical.
- R - Rate/Ratio: The "What's the Relationship?" Question
- Resulting KPI: Viewership Prediction Accuracy
- Inferred Trend: Increase 📈
- Evidence: As live events become a significant new revenue driver, accurate viewership predictions are critical for setting ad prices and meeting advertiser expectations.
- I - Index/Indicator: The "How Did It Feel?" Question
- Resulting KPI: Internal User Satisfaction Score
- Inferred Trend: Increase 📈
- Evidence: The company has invested in its own in-house ad tech platform and is heavily focused on improving internal tools to streamline operations and empower teams to execute on new strategies.
- C - Change: The "What's the Direction?" Question
- Resulting KPI: Ad Revenue Forecast Trend
- Inferred Trend: Increase 📈
- Evidence: Netflix has officially stated that it expects to "roughly double" its ad revenue in 2025, and it has secured sold-out ad inventory for marquee events like the NFL Christmas games.
- S - Significance: The "What Shows Deep Value?" Question
- Resulting KPI: Repeat Partner Event Rate
- Inferred Trend: Increase 📈
- Evidence: The company's ability to retain key partners like the NFL and WWE for multi-year deals is the ultimate signal of a successful and reliable operational workflow.
Global Distribution
- M - Magnitude: The "How Much?" Question
- Resulting KPI: Total Terabytes of Data Transferred
- Inferred Trend: Increase 📈
- Evidence: The addition of 94 million monthly active users on the ad-supported tier and the overall growth in total viewing hours will inevitably lead to a higher volume of data transferred.
- E - Efficiency: The "How Fast/Easy?" Question
- Resulting KPI: Average Time to First Frame
- Inferred Trend: Decrease 📉
- Evidence: The company's goal is to improve the user experience, and a faster start time directly correlates with higher user satisfaction and less churn, a key metric in their new strategy.
- T - Threshold: The "Did It Work?" Question
- Resulting KPI: Playback Error Rate
- Inferred Trend: Decrease 📉
- Evidence: With a new focus on revenue and profitability, the company cannot afford technical errors that frustrate users and lead to churn, making reliability a top operational priority.
- R - Rate/Ratio: The "What's the Relationship?" Question
- Resulting KPI: Local-to-Global Traffic Ratio
- Inferred Trend: Increase 📈
- Evidence: To handle the increased traffic from a growing user base and live events, Netflix must increase its reliance on local servers to reduce latency and data transfer costs.
- I - Index/Indicator: The "How Did It Feel?" Question
- Resulting KPI: Perceived Video Quality Score
- Inferred Trend: Increase 📈
- Evidence: Netflix's decision to offer 4K quality and other premium features across its plans, and its focus on the user experience in its shareholder letters, points to a clear goal of improving perceived quality.
- C - Change: The "What's the Direction?" Question
- Resulting KPI: Cost Per Terabyte of Data Transferred Trend
- Inferred Trend: Decrease 📉
- Evidence: The company's emphasis on expanding operating margins and profitability necessitates a relentless focus on reducing operational costs, including global data transfer fees.
- S - Significance: The "What Shows Deep Value?" Question
- Resulting KPI: 4K/High-Resolution Content Playback Rate
- Inferred Trend: Increase 📈
- Evidence: The company is pushing higher-quality content and is seeing a record share of TV viewing, which signals that users are increasingly watching on large-screen devices capable of high-resolution playback.
Live Stream Management & Monitoring
- M - Magnitude: The "How Much?" Question
- Resulting KPI: Peak Concurrent Viewership
- Inferred Trend: Increase 📈
- Evidence: The NFL Christmas Day games set a streaming record, with an average audience of 24 million viewers, a clear signal of massive concurrent viewership.
- E - Efficiency: The "How Fast/Easy?" Question
- Resulting KPI: End-to-End Latency
- Inferred Trend: Decrease 📉
- Evidence: The core purpose of a live stream is to minimize latency. The successful broadcast of major, high-stakes events like the NFL games and the Jake Paul vs. Mike Tyson fight confirms that infrastructure is a top priority.
- T - Threshold: The "Did It Work?" Question
- Resulting KPI: Stream Uptime Percentage
- Inferred Trend: Increase 📈
- Evidence: Any downtime for a high-value live event like the NFL or WWE is a public relations and financial disaster. The company's ability to host these events without widespread technical issues confirms a high-uptime standard.
- R - Rate/Ratio: The "What's the Relationship?" Question
- Resulting KPI: Buffering Rate per Viewing Hour
- Inferred Trend: Decrease 📉
- Evidence: A low buffering rate is essential to a good user experience. Netflix has heavily invested in its CDN and infrastructure to handle large, unpredictable live audiences, with successful results.
- I - Index/Indicator: The "How Did It Feel?" Question
- Resulting KPI: Live Event Viewer Satisfaction Score
- Inferred Trend: Increase 📈
- Evidence: Viewer satisfaction is a key driver for live event engagement and advertising value. The positive media and analyst reception to the NFL and other live events suggests a favorable audience response.
- C - Change: The "What's the Direction?" Question
- Resulting KPI: Live Viewership Trend by Day/Genre
- Inferred Trend: Increase 📈
- Evidence: Netflix is strategically adding a growing slate of live sports and entertainment to create "appointment viewing" and drive consistent user engagement beyond its core on-demand library.
- S - Significance: The "What Shows Deep Value?" Question
- Resulting KPI: Live Chat/Engagement Rate
- Inferred Trend: Increase 📈
- Evidence: The introduction of live chat and fan interaction features for events like the Tom Brady Roast and the Jake Paul boxing match demonstrates a new focus on deepening user engagement.
Content Ingestion & Processing
- M - Magnitude: The "How Much?" Question
- Resulting KPI: Total Ingested Content Hours
- Inferred Trend: Increase 📈
- Evidence: Netflix is increasing its content spending and has signed multi-year deals for major live events like the NFL Christmas games and WWE's Raw, which adds significant hours to its library.
- E - Efficiency: The "How Fast/Easy?" Question
- Resulting KPI: Average Time to Transcode
- Inferred Trend: Decrease 📉
- Evidence: Netflix's heavy investment in and stated focus on bringing its ad tech and overall platform capabilities in-house implies a goal of greater control and optimization to reduce friction and improve speed.
- T - Threshold: The "Did It Work?" Question
- Resulting KPI: Successful Transcoding Rate
- Inferred Trend: Increase 📈
- Evidence: As a global, brand-conscious leader, Netflix's core business relies on a near-perfect success rate. The company's focus on profitability and user satisfaction demands a high-quality, reliable core library.
- R - Rate/Ratio: The "What's the Relationship?" Question
- Resulting KPI: Automated Processing Success Ratio
- Inferred Trend: Increase 📈
- Evidence: A core strategic priority is to "leverage our technology" to improve efficiency and profitability, which points directly to an emphasis on maximizing automated workflows to reduce costly manual intervention.
- I - Index/Indicator: The "How Did It Feel?" Question
- Resulting KPI: Partner Effort Score (PES)
- Inferred Trend: Decrease 📉
- Evidence: Netflix is an industry giant and a destination for content, giving it leverage to prioritize its own internal systems and standards, even if it requires more effort from partners.
- C - Change: The "What's the Direction?" Question
- Resulting KPI: Content Library Growth Rate (per quarter)
- Inferred Trend: Increase 📈
- Evidence: Netflix has committed to a large-scale, diversified content investment strategy, including live sports, gaming, and a continued focus on both local and global original productions.
- S - Significance: The "What Shows Deep Value?" Question
- Resulting KPI: Complex Metadata Attachment Rate
- Inferred Trend: Increase 📈
- Evidence: The company is focusing on enhancing the "depth" of its service through advanced features like an ad-supported plan that requires detailed metadata for ad targeting and games that integrate with the core service.
PIVOT
Opportunity-Seeking to Problem-Finding
Measurement Areas
Solution Space
Problem Space
Lean UX
Explore & Create
Make
YOUR OPPORTUNITY TO CREATE SOMETHING VALUEABLE.
Lean UX
Evaluate & Check
YOUR OPPORTUNITY TO CREATE SOMETHING VALUEABLE.
Executive Summary: Key Experiment Outcomes
Key Metric:
Q Period Retention
Uplift +10.1%
Data Professionals
Key Metric:
Feature Stickiness
Uplift +31.1%
CLIP ID
Key Metric:
Q Period Retention
Uplift +12.4%
Enterprise Admins
Executive Summary:
Executive Summary:
Key Metric:
Feature Stickiness
Uplift +31.1%
CLIP ID
Key Metric:
Feature Stickiness
Uplift +5.1%
Data Health Analytics
Key Metric:
Feature Stickiness
Uplift +12.1%
Data Querying
Key Metric:
Feature Stickiness
Uplift +12.1%
Data Querying
Lift Summary:
Lift Summary:
What I do
Sometimes over coffee, others during a short walk. Always timely and always focused.

Scroll Right

Collaborate with the most opinionated, seasoned, designers, engineers and product partners.

Create Prototypes with Figma Make, Figma Standard
Create a multi-segment cloud infrastructure experience. Every content list must have a success, failure, in progress, warning, educational and no-data state. Introduce global or app variables to enable interactivity.

I create & build for product pillars. Growth experiences, engagement journeys, monetization technology and much more.
Giant smile, strong eye contract, always happy to network & grow design.
Inspire others by learning together, owning product pillars, & advising perspective adjustemnts.
Pillar-centric for experience objectives like Global Search across surfaces & strategic inefficiencies to speed up mission statements.
Actively mentor systematic thinking, nuanced order level abstraction & much more.
Mutually Exclusive & Comprehensively Exhaustive Concept categorization
Narrow most: Content list strategy
Broad most: G.E.M. journey contextualization
Content strategy: fundamental marketing force vs fundamental Internal adoption force
New future journey innovation, & sustainable experience growth
Information intake, information analysis & information evaluation.
M.E.T.R.I.C.S.
Influence changes to systemic initiatives like Design Systems, Tech implementations & major culture shifts.
Guide, improve, implement
Customer support is spiking - search surface issues!
Let’s add a new integration partner.
With change management & routine maintenance presentation! I’ve built some samples. Linked below...
Corelogic
Project Objective:
Discovered & implemented positive uplift for key business drivers: Growth, Engagement, & Security/Governance
Growth
Engagement
Security/Governance

9:41
24

www.
Store
3
Instant Property Data
Order the property data you need and download reports in minutes.
123 Main Street, Anytown, CA 12345
CLIP ID
1928 Mapleton Ave, Boulder, CO 80304
Property data has been recently updated for this location. Go the the address here.
Payment Issue
Please update payment method
There is currently no active payment method on this account. Go to payment page here.
Property Data Bundles
New
Property Risk Bundle
Evaluate property risks with the property risk bundle. Start growing your practice here.
Home
Portfolio
Search
Offers

Dashboard

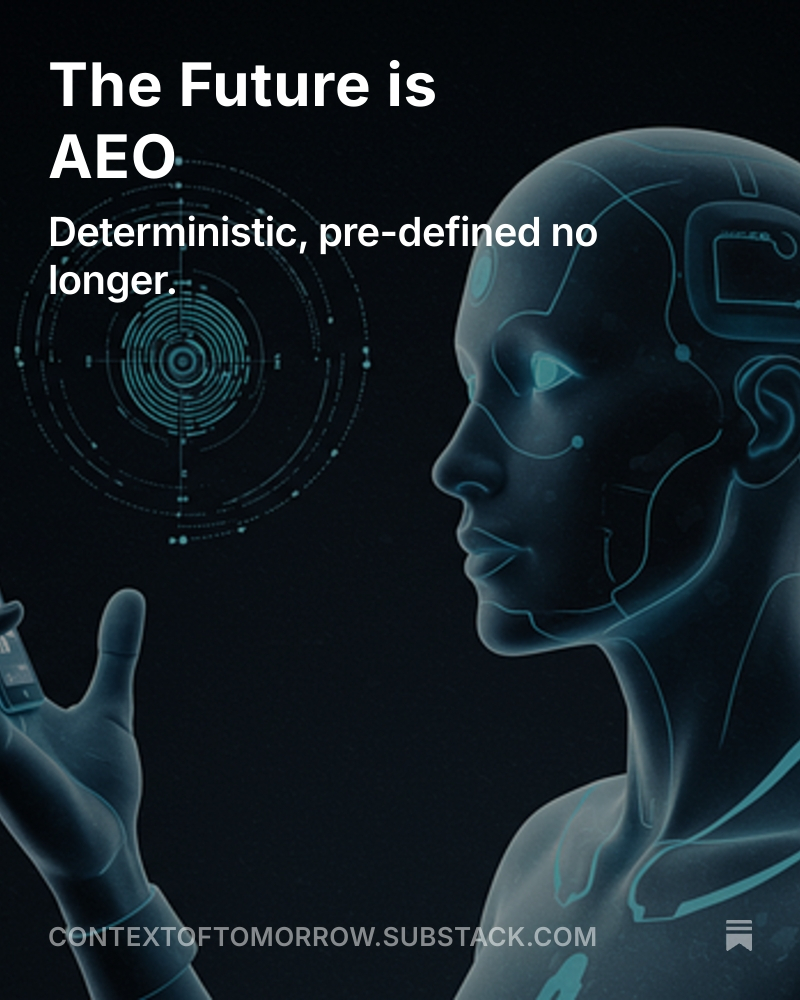
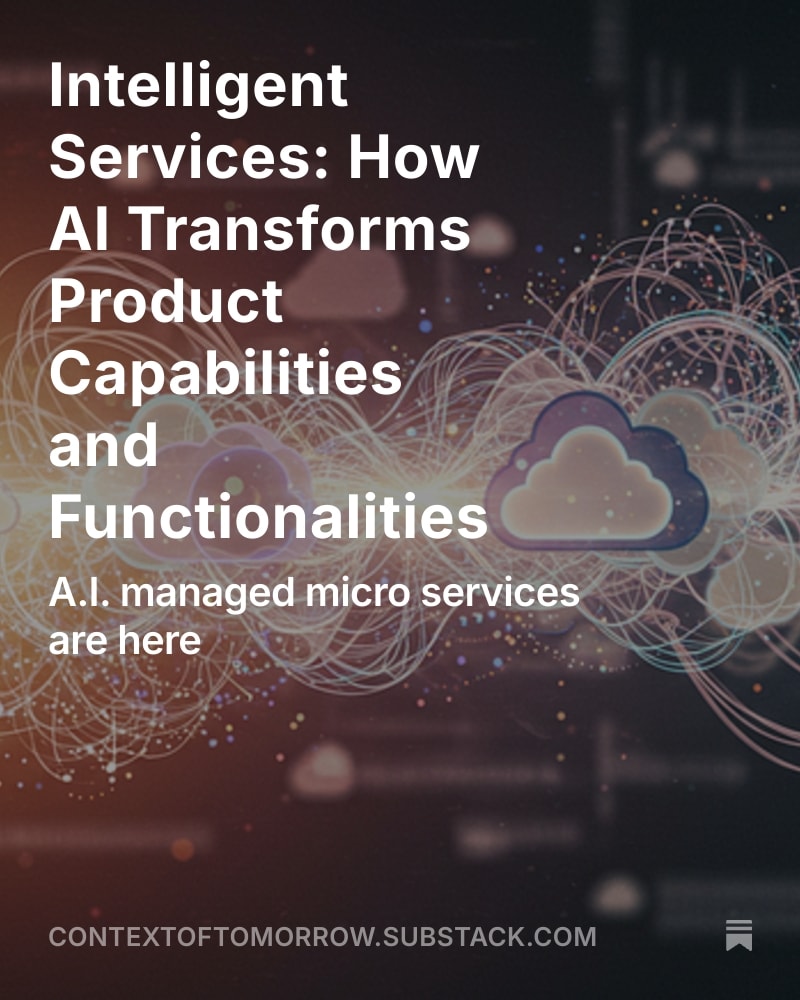
Substack Articles - CONTEXTOFTOMMOROW.SUBSTACK.COM
Leading the designers of tomorrow by applying insightful commentary and constructive criticism to industry norms.
Leadership
Mentorship
1-hour or under projects
A.I. Augmented

Business Drivers Key
Costco, 2024, 2025
Summary
The leadership's high-level strategic goals for Costco in 2025 are highly focused on Growth and maintaining its fundamental value proposition which anchors its Monetization (membership revenue) and Engagement (loyalty) drivers.

Research disclaimer
Based on in-depth research of investor relations, earnings reports, and strategy discussions for the 2024 and 2025 fiscal years.
Primary Strategic Goals
The high-level strategy is characterized by an aggressive pursuit of Growth paired with a commitment to value to sustain Engagement and the highly profitable Monetization driver of membership fees.
Growth
Engagement
Monetization
Corporate Goal
Prioritized Driver(s)
Specific Focus/Key Results
Aggressive Global Physical Expansion
Growth (Acquisition) & Support (Operational)
Open approximately 25-30 new warehouses globally in FY 2025/2026.
Deepen Member Loyalty and Value
Monetization (Renewal Rate) & Engagement (Retention)
Maintain >90% membership renewal rates (e.g., U.S./Canada at 92.3% as of Q4 2025) and increase penetration of the higher-value Executive membership.
Accelerate Digital Transformation
Growth (New Channels) & Engagement (Interaction Rate)
Achieve double-digit e-commerce growth (e.g., Q4 2025 growth of 13.6%) and enhance the member digital experience (app features, improved logistics).
Commitment to Core Value Proposition
Monetization (Margin Control) & Support (Supply Chain/Pricing)
Maintain price integrity by keeping markups capped and mitigating cost pressures like tariffs through strategic sourcing and inventory management, ensuring the lowest sustainable prices.
Advance Environmental Responsibility
Governance & Security (ESG Compliance/Risk)
Achieve net-zero emissions by 2050 with interim 2030 targets (e.g., Scope 1 & 2 reduction).
Inferred Prioritization Framework
Prioritization
Summary
Given the clear leadership goals, product and cross-functional teams would prioritize initiatives that directly impact Membership Renewal/Sales Growth (the primary revenue engines) and Operational Efficiency (which supports the value proposition). A Weighted Scoring Model is the most likely framework, heavily weighting Monetization, Growth, and Cost/Effort.

KEY DISCLAIMER
The specific numerical weights (×5, ×4, ×3, etc.) and scoring of the initiatives in this case study are inferred and entirely hypothetical. Costco Wholesale Corporation does not publicly disclose the internal proprietary weighting models it uses for product and feature prioritization.
The inferred priorities directly correlate with recent, highly-publicized initiatives:
The focus on e-commerce enhancements and better inventory visibility aligns directly with the "Accelerate Digital Transformation" goal.
The low relative weighting for Governance (×1) reflects the reality that while compliance and ESG are critical, the company primarily competes on value, not regulatory features.
Inferred Structured Weighted Scoring Model
The inferred model would use weights to reflect the strategic focus on membership stability, sales, and capital allocation (warehouse build-out and IT).
Driver (Criteria)
Weight (Inferred)
Rationale
Monetization (Membership/Sales Lift)
×5 (Highest)
Direct impact on the most profitable revenue stream (fees) and overall sales volume; central to investor expectations.
Growth (New Member Acquisition/Channel)
×4 (High)
Supports global expansion and e-commerce acceleration targets.
Engagement (Retention/Use)
×3 (Medium-High)
Critical to sustaining the membership model (renewal rates). Initiatives that drive traffic or frequency would score highly.
Cost/Effort (Inverse - Efficiency/Simplicity)
×3 (Medium-High)
Operational simplicity and low overhead are core to the business model; low-effort, high-impact projects are essential.
Support (Technical Stability/Reliability)
×2 (Medium)
Ensures new warehouse and e-commerce systems are robust enough to handle rapid scaling.
Governance/Security (Compliance/ESG)
×1 (Low)
While important (Net-Zero goals, labor practices), these are typically non-revenue-generating compliance projects, which often receive a baseline priority to ensure risk management rather than a high competitive weight for feature prioritization.
My recommendations
Initiatives
Narrative Summary
The narrative for these feature is derived from bridging the core strategic goals (Monetization and Growth) with a critical Engagement problem for the member.
Second initiative targets a classic retail opportunity: leveraging the efficiency of digital ordering while retaining the engagement and upsell potential of the physical store.
- Local Warehouse Inventory Tracker
Problem:
The core of Costco's model is the "Treasure Hunt" experience, which drives high Average Transaction Value (ATV) and unplanned impulse buys. However, for high-consideration, essential, or seasonal items, the lack of inventory visibility (the "Is it in stock?") creates a Member Friction and Retention Risk. A member drives to the warehouse specifically for an item, finds it out of stock, and experiences a wasted trip. This directly threatens the member's perception of value and convenience, leading to potential drops in frequency and, critically, Executive Member Renewal.
Opportunity (The GEMSG Solution):
Monetization & Engagement: Solve the friction by enabling pre-trip certainty. The "Tracker" validates the trip, guaranteeing that members who drive to the store will complete their intended purchase, thereby protecting the core revenue stream (sales volume and membership fees). It turns high-friction trips into high-confidence trips.
Growth (Omnichannel): The feature encourages members to use the digital channel (the App) to facilitate an in-store physical transaction (the most profitable transaction). It is the perfect omnichannel bridge required to meet the leadership's "Accelerate Digital Transformation" goal without cannibalizing the highly profitable warehouse traffic.
- Click & Collect Sample Lottery
Problem:
As E-commerce grows (a ×4 Growth driver), there is a risk that members will shift high-margin impulse buys from the warehouse to the app. A typical "Click & Collect" shopper bypasses the entire store, missing the ATV-boosting sample stations and "treasure hunt" displays.
Opportunity (The GEMSG Solution):
Engagement & Monetization: By attaching a "Sample Lottery" to the in-store pickup process, you create an exclusive, high-value incentive to walk past the sample stations or even briefly enter the store. This reintroduces the impulse opportunity that drives high Average Transaction Value (ATV).
Growth (Behavior Modification): It encourages the desired omnichannel behavior—using the efficient digital channel for ordering but requiring a physical presence for the reward. This is a low-Cost/Effort way to drive digital orders that still have a high chance of resulting in unplanned purchases.