The Future is CLIP ID in Cotality
Guiding, Contributing & Consulting
Arturo Garcia, Corelogic (Now Cotality), Property Data
Why increased demands for data quality, robust systems and instantaneous support will bring about the CLIP ID powered futured.
Guiding, Contributing & Consulting
1
- Key Trend in Real Estate Industry
Customers that purchase increasingly more data reports expect increasingly more robust features from the platform delivering the insights. Quality signals for data become a crucial aspect of process validation as industry tools and adjacent technology promises more complex in-depth analysis our users provide these systems.
1. Demand for Granular, Real-Time Data and Deeper Insights
In 2020, there was a clear move away from simple, aggregated data toward more detailed, granular analysis. Customers wanted to go beyond just "what happened" to "why it happened" and "what to do next." This is seen in:

Sharp increase in customer support requests related to data quality, and interest in more rich signals.
Cited Report
Rich complex data signal export for existing tools or an upgraded dashboard with ongoing changes.
Internal Trends
3. Personalization Driving Feature Expectation
A key driver of the need for better data and more features was the customer's expectation of personalization. By 2020, generic experiences were no longer acceptable.
Market Trends
2. Increased Focus on Data Quality and Validation
As data became the foundation for critical business decisions, its quality became paramount. Customers and regulators alike demanded proof that the data was accurate, complete, and trustworthy.
Cited Report
Cited Report
User Trends
Internal Business Trends
Release and active internal rollout of CLIP ID, implementing into tech stack across teams. Successfully gaining traction.
Business units experience demand for interactive data sets, configurable and personalized for use cases as new trends emerge.
+ 10 additional trends
+ 10 additional trends
TRENDS
2
3
Vision Prototypes
- Complex dashboard with features requires high learning curve for internal understanding and support.
- Key activation requirements increases to multi-action journeys, Lengthening notable wins due to confounder variables.
- Governance for maintaining new data types and analysis on data requires additional security, reliable measures.
- Increased maintenance costs for robust data signals.
- CLIP ID Vision
Addressing tomorrow’s problems, today.
5 Year
Design
Conceept

Solving the Problem of Tommorow
CLIP ID
Day in the life of a user in the future experience.
People, Processes & Project
- Start a new work project
- Start up tools of choice
- Fuel up on data of choice

OUR IP
- Drive project in tool of choice or our many solutions
+10
solutions
- New tool suite
CLIP ID
Identifier-focused platform, CLIP ID lens
Lifetime analysis
Solution 1
Lifetime opportunity evaluations
Highly usable & efficient
Solution 2
Identifier-focused reframing
Adaptive design on all user journeys
Lifetime opportunity evaluations
CLIP ID
Solution 1

9:41


24


www. 209 - 12 -12


CLIP ID


3
209 - 12 -12

Data Analytics
Property Management
Marketing & CRM
Smart Home
Fin Tech
Marketplace & Search
AR & VR
Transaction Management

CLIP Home

Data

Search

Offers

Dashboard
Identifier-focused platform, CLIP ID lens
Solution 2
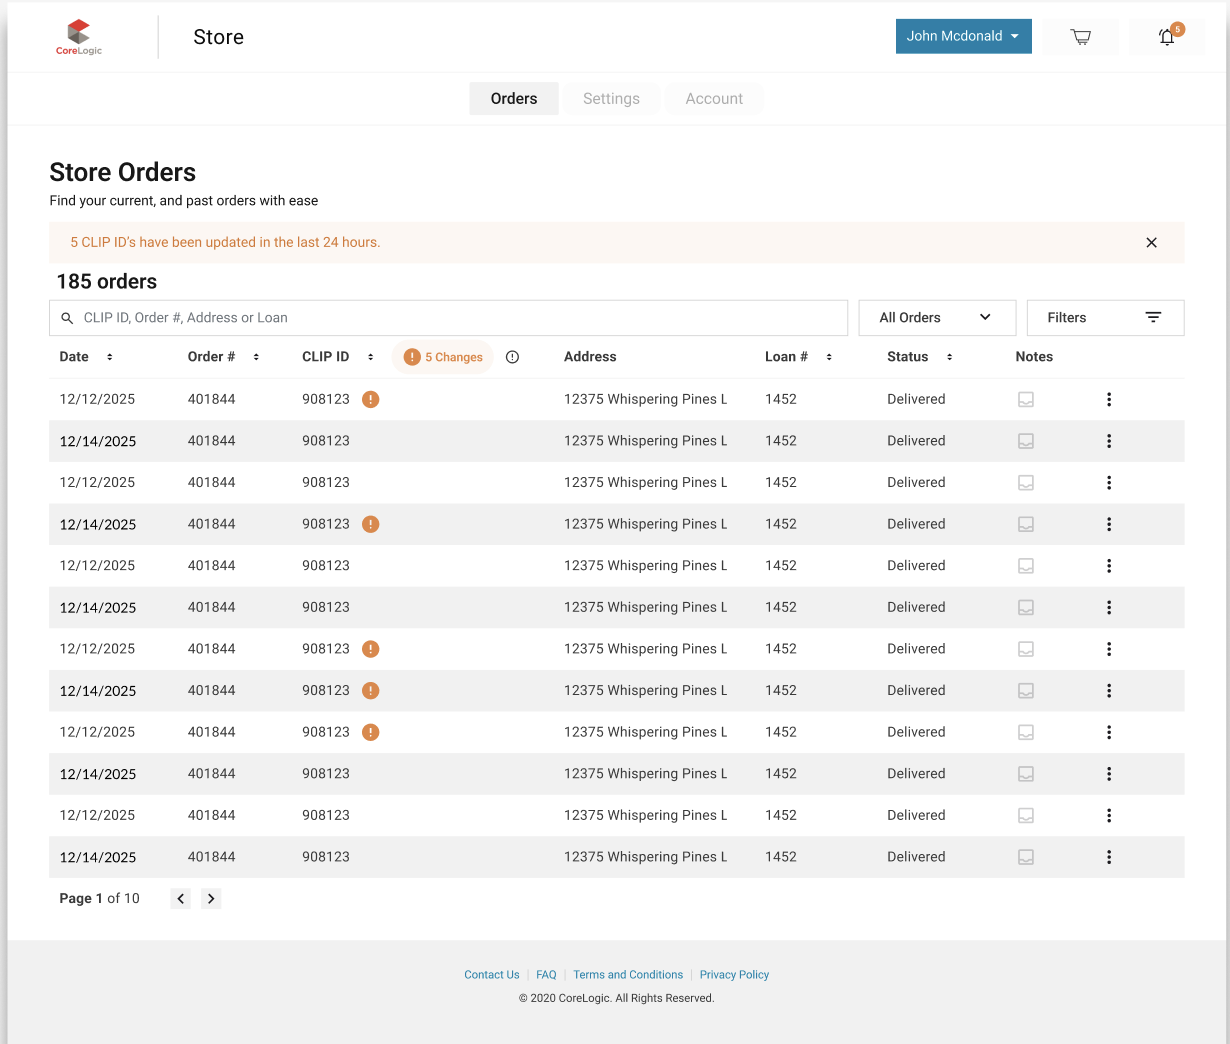
Identifier-focused platform, CLIP ID lens - Corelogic: Store
9:41
24

www.
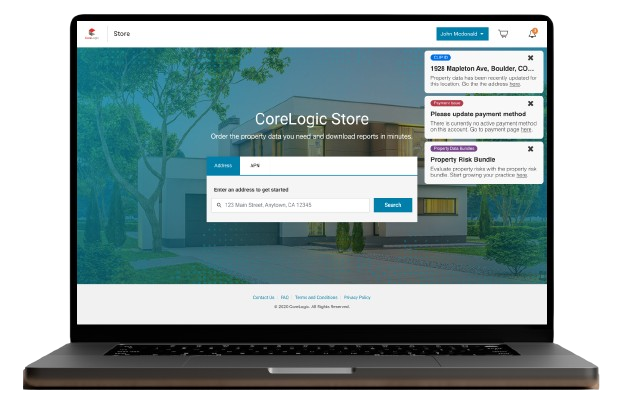
Store
3
Instant Property Data
Order the property data you need and download reports in minutes.
123 Main Street, Anytown, CA 12345

CLIP ID

1928 Mapleton Ave, Boulder, CO 80304
Property data has been recently updated for this location. Go the the address here.
Payment Issue
Please update payment method
There is currently no active payment method on this account. Go to payment page here.
Property Data Bundles
New
Property Risk Bundle


Evaluate property risks with the property risk bundle. Start growing your practice here.
Home
Portfolio

Search

Offers
Dashboard
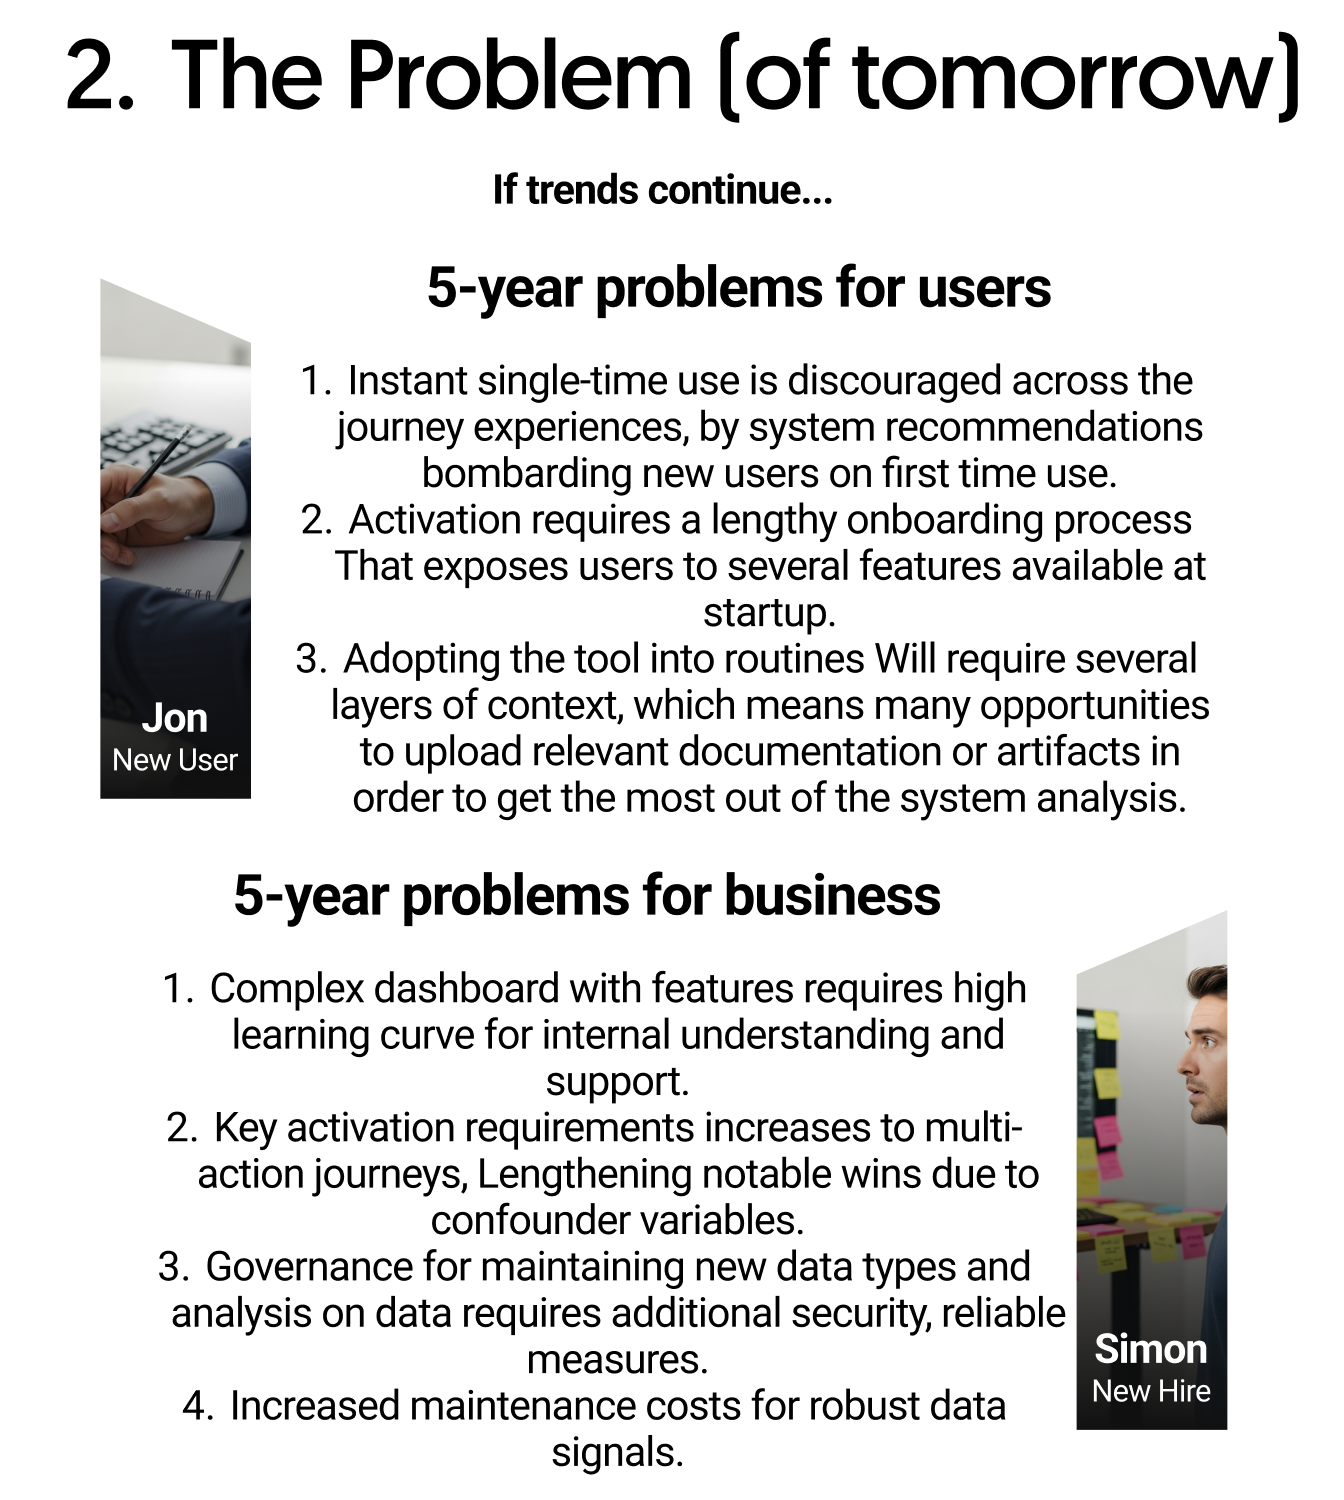
- The Problem (of tomorrow)
If trends continue...

Jon
New User
5-year problems for users
- Instant single-time use is discouraged across the journey experiences, by system recommendations bombarding new users on first time use.
- Activation requires a lengthy onboarding process That exposes users to several features available at startup.
- Adopting the tool into routines Will require several layers of context, which means many opportunities to upload relevant documentation or artifacts in order to get the most out of the system analysis.

Simon
New Hire
5-year problems for business
- Complex dashboard with features requires high learning curve for internal understanding and support.
- Key activation requirements increases to multi-action journeys, Lengthening notable wins due to confounder variables.
- Governance for maintaining new data types and analysis on data requires additional security, reliable measures.
- Increased maintenance costs for robust data signals.
PROBLEM
Triggers /
Event Alert
Event Alert
Providing ephemeral feedback to a client in response to an event’s processing state.
Design point of contact
Arturo Garcia
Questions, comments, feedback?
Leave a comment in Figma or reach out to us on slack #ensemble-irvine
9:41
24
www.
Store
3
Instant Property Data
Order the property data you need and download reports in minutes.
123 Main Street, Anytown, CA 12345

CLIP ID
1928 Mapleton Ave, Boulder, CO 80304
Property data has been recently updated for this location. Go the the address here.
Payment Issue
Please update payment method
There is currently no active payment method on this account. Go to payment page here.
Property Data Bundles
New
Property Risk Bundle
Evaluate property risks with the property risk bundle. Start growing your practice here.
Home
Portfolio
Search
Offers
Dashboard
API
Type
The type of alert.
success
failure
in-progress
warning
education
Title
Specifies whether a title is included in the event alert.
false
true
Auto-Dismissable
Specifies whether the alert with be auto dismissed after an expiring time limit.
false
true
CTA
Specifies whether the event alert has an optional CTA.
false
true
Anatomy
An event alert is made up of exactly a badge, a header, two lines of text, a CTA to dismiss the message and an executable call to action to address the response.
CLIP ID

1928 Mapleton Ave, Boulder, CO 80304
Property data has been recently updated for this location. Go the the address here.
Optional call-to-action
Dismiss
Type Badge
Header
Text


Variants
Event alerts come in 5 different types depending on the feedback the system will be providing clients.
Content Type

Relevant FMF or Status Change
Relevant details about the system process. Optional CTA.
Failure type
Failure Fix Declaration
Relevant details about the failed process and Addessible CTA.
Education
Feedback that the system has introduced a new change and the client now has access to the change.
Failure
A system response that was attempted failed to be processed. This client will need to address a requirement before using the service.
In-Progress Type
Info header
Details on a client action that is still processing.Optional CTA.
Success Type
Success Notice
Relevant details about the system successfully processing a delayed action. Optional CTA
In-Progress
Feedback that an action is still in progress and has not be archived or paused.
Success
Response that an action that was to be processed could failed to execute and thus was was unsuccessful.
Warning Type
Relevant Expiring Requirement
Relevant details about the system process. Executable CTA.
Warning
Feedback that an action that a client has taken will not be expiring and require attention.
Usage
An event alert is an ephemeral system response that should be able to inform users of relevant system details and can easily dimissed.
Do use for
- Ephemeral feedback notice - a message used to follow up an action that was taken by a client.
- Examples include:
- Property data set updated
- Processing a non-instant data report
- Expiring payment method
- Successful monthly payment processing
Don’t use for
- Error Handling - a response to a submission form and a requirement that has not been met under a real-time condition. Use error handling components.
- Server Alerts - a message that tells a client there is system technical issues occurring. Use a server banner instead.
- Help Banners - content that is used to provide answers to frequently asked scenarios.
Behavior
Event alerts can be dismissed at any time. Pressing on the Dismiss icon closes the message from the feed page.
Alerts are still live in their respective surfaces. All alerts sit on top of the BG content on the feed with highest z index.
Insets
Event alerts are designed to be inset. This treatment allows them to stand out from the rest of the content.
The default left and right inset on the alerts component is 9px on mobile. Top and bottom insets can be turned off spending on the surrounding context. Avoid removing the insets and stretching alerts edge to edge.
Stacking
If there are multiple alerts, they should be stacked sequentially with the newest message placed 9px above the older alert.
Interaction
Clients can dismiss, otherwise it auto-dismisses after 5 seconds is a success or education. Failure, warnings and in-progress will be manually dismissed.
Placement
Floating contextually at the bottom of the screen above any fixed CTA’s.

9:41


24


www.

Store


3
Instant Property Data
Order the property data you need and download reports in minutes.
123 Main Street, Anytown, CA 12345

CLIP ID

1928 Mapleton Ave, Boulder, CO 80304
Property data has been recently updated for this location. Go the the address here.
Payment Issue
Please update payment method
There is currently no active payment method on this account. Go to payment page here.
Property Data Bundles
New
Property Risk Bundle


Evaluate property risks with the property risk bundle. Start growing your practice here.

Home

Portfolio
Search

Offers

Dashboard
9:41
24
www.
Store
3
Instant Property Data
Order the property data you need and download reports in minutes.
123 Main Street, Anytown, CA 12345
CLIP ID
1928 Mapleton Ave, Boulder, CO 80304
Property data has been recently updated for this location. Go the the address here.
Payment Issue
Please update payment method
There is currently no active payment method on this account. Go to payment page here.
Property Data Bundles
New
Property Risk Bundle
Evaluate property risks with the property risk bundle. Start growing your practice here.
Home
Portfolio
Search
Offers
Dashboard
Do
Do place alerts in line.
Don’t
Overlay alerts on top of fixed CTA’s at the bottom of the screen.
Content guidelines
Must include the subject and object. Can wrap to two lines.
Examples
Treatment of the event alerts on the current home page.
9:41
24
www.
Store


3
Instant Property Data
Order the property data you need and download reports in minutes.
123 Main Street, Anytown, CA 12345
CLIP ID
1928 Mapleton Ave, Boulder, CO 80304
Property data has been recently updated for this location. Go the the address here.
Payment Issue
Please update payment method
There is currently no active payment method on this account. Go to payment page here.
Property Data Bundles
New
Property Risk Bundle


Evaluate property risks with the property risk bundle. Start growing your practice here.

Home

Portfolio

Search

Offers

Dashboard
Future CLIP ID
Interaction & State Layer
Interaction Layer Guidance
4
Year 3: Proving the Value.
Clip ID is successfully piloted with a key segment of our most sophisticated clients (e.g., institutional investors, insurance underwriters). We demonstrate a measurable lift in their decision-making speed and accuracy. The primary data sources—public records, MLS data, and geospatial information—are fully onboarded and linked via Clip ID.
To make our five-year vision tangible, we start at the destination and work backward. This backcasting process creates a plausible, step-by-step roadmap, transforming an ambitious goal into an achievable plan.
- Vision for solving future problems
Backcasting: Charting the Path from the Future
Year 4: Scaling Intelligence.
Clip ID is fully integrated across all major Cotality product suites. The knowledge graph is mature enough to support client-facing AI and machine learning tools. We launch our first fully predictive, public-facing data product, which becomes the new industry benchmark.
Desired Future State (Year 5):
Cotality is the undisputed industry leader in predictive property intelligence. Our clients no longer just pull historical data; they subscribe to forward-looking insights powered by Clip ID. We have successfully launched a new class of data products (e.g., "Climate Resilience Trajectories," "Component-Level Depreciation Models") that have created a deep competitive moat and significantly increased revenue per client.
Year 2: Building the Foundation.
The core Clip ID architecture is developed and deployed internally. We establish the universal data ontology required to link disparate data types (e.g., connecting a building permit to an insurance claim to a subsequent sales record). The system begins tagging and unifying new data as it enters the Cotality ecosystem.
Year 1 (Today): Securing Commitment & Laying Groundwork.
We achieve executive buy-in for the Clip ID vision. A dedicated, cross-functional team of data architects, product designers, and engineers is formed. Initial R&D focuses on a high-value proof-of-concept: creating a unified, historical "clip" for all properties in a single major metropolitan area, demonstrating the immediate value of contextual linkage.
Vision problems
If/Then Statements: The Logic of Causation
These statements form the core of our causal argument, explicitly connecting the foundational trend to the business outcome through our strategic intervention.
If the volume, velocity, and variety of property data (from sources like IoT, climate models, and drone imagery) continue their exponential growth, then legacy data systems will fracture, making it impossible to generate the holistic, real-time insights our clients need to remain competitive.
If we successfully implement Clip ID to act as a universal, contextual identifier for every data point associated with a property's lifecycle, then we will transform our fragmented data lake into a powerful, queryable knowledge graph.
If we externalize the power of this knowledge graph through our solution ecosystem, then Cotality will unlock true predictive analytics for our clients, creating an insurmountable strategic advantage and transitioning our business model from selling data to selling indispensable intelligence.
Leading Indicators: Measuring the Future, Today
To de-risk our five-year vision, we will track a set of leading indicators. These are near-term, measurable signals that will tell us if we are on the right path long before the final outcome is realized. They provide a continuous feedback loop to validate our causal assumptions.
System & Adoption Indicators: These metrics confirm the technology is working and being adopted internally.
- Data Unification Rate: The percentage of new and key historical datasets successfully indexed with Clip IDs. Target: 75% of Tier-1 datasets by the end of Year 2.
- Internal API Calls: The number of internal product teams building new features and services that query the Clip ID knowledge graph instead of legacy databases.
Performance & Quality Indicators: These metrics prove that Clip ID is creating higher-quality, more efficient data assets.
- Time-to-Insight: A measured reduction in the time it takes for analysts (internal and client-side) to execute complex, multi-source queries (e.g., "Find all properties in coastal Florida with a 20-year-old roof, no storm shutters, and a high flood-risk score").
- Data Discrepancy Reduction: A quantifiable decrease in errors and mismatches between different datasets for the same property.
Early Business Impact Indicators: These metrics provide the first signals of market validation and value creation.
- Pilot Client Engagement: The frequency and complexity of queries from our pilot clients. We will look for a shift from simple data retrieval to complex, exploratory questions that were previously impossible to ask.
- New Product Pipeline Velocity: The number of new, high-value product concepts developed by our product teams that are explicitly enabled by Clip ID's capabilities.
Acknowledge and Address Potential Challenges
A vision of this scale is not without significant risks. Demonstrating strategic leadership requires not only presenting an optimistic future but also rigorously identifying potential points of failure and preparing for alternative outcomes. By conducting a pre-mortem and evaluating other strategic paths, we can prove that this vision is not only ambitious but also resilient.
1. The Risk of Technical Debt & Legacy Gravity:
- What Could Go Wrong:
CoreLogic's existing infrastructure is vast and complex. The sheer inertia and interconnectedness of our legacy systems could make the integration of Clip ID impossibly slow, expensive, and fragile. We could spend years and hundreds of millions of dollars only to create a new layer on top of a crumbling foundation.
- Mitigation Strategy:
We will adopt a phased, API-first approach. Instead of a "big bang" replacement, Clip ID will be introduced as a service that initially runs parallel to legacy systems. We will target the highest-value, most modern data streams first (e.g., our new climate risk models) to demonstrate immediate value and build momentum before tackling the most entrenched legacy databases.
What Could Go Wrong:
Individual business units, comfortable with their existing data silos and workflows, may resist adoption. They may view Clip ID as a top-down mandate that conflicts with their immediate quarterly goals, leading to passive-aggressive resistance, slow adoption, and a failure to achieve the network effect required for the knowledge graph to become truly powerful.
Mitigation Strategy:
The Clip ID initiative must have unwavering executive sponsorship. We will form a dedicated "Enablement Team" whose sole purpose is to evangelize the vision internally and provide tools, training, and direct engineering support to help product teams migrate. Success will be tied to team-level objectives and incentives.
- The Risk of a Shifting Market & Competitive Leapfrogging:
What Could Go Wrong:
The five-year timeline is a significant window of opportunity for competitors. A nimble, well-funded startup could ignore the challenge of unifying legacy data and focus on a narrow, high-value vertical (e.g., AI-driven insurance underwriting). They could achieve a "good enough" level of predictive power in 18-24 months, capturing a key market segment while we are still in the foundational building phase.
Mitigation Strategy:
Our backcasting roadmap is designed to deliver incremental value at every stage. The "Year 1" proof-of-concept and "Year 3" client pilot are critical milestones designed to produce tangible, marketable outputs. This ensures we are not waiting five years for a payoff but are strengthening our market position and client relationships throughout the process.
Future Challenges
5